


A new audit evidence standard has been released by the American Institute of Certified Public Accountants (AICPA) that includes significant updates around how technology and automation can be leveraged throughout the audit process. Here, we’ll examine this standard and some of the most significant examples of how the AICPA has explicitly considered the applicability of analytics and automation to how audit evidence is gathered and concluded upon.
The Statement on Auditing Standards (SAS) No. 142 Audit Evidence is relevant for private company audits and takes effect for periods ending on or after December 15, 2022.
While the effective date of the guidance allows for lead time for the appropriate methodology changes and technology investment to be contemplated and implemented by firms ahead of calendar 2022 audits, the updates reflect the massive tailwinds of how data analytics and automated tools and techniques are well-positioned as catalysts for the reimagining of the audit life cycle. Furthermore, the potential afforded by these technologies to drive monumental improvements in both quality and effectiveness is only amplified further in today’s remote work environment.
Key concepts around audit evidence
It’s worth revisiting some of the basic principles around audit evidence and the responsibilities of the auditor before discussing how data analytics and automation can be transformative to how evidence is collected and generated.
The new standard clearly defines the auditor’s objective around audit evidence as follows:
“The objective of the auditor is to evaluate information to be used as audit evidence, including the results of audit procedures, to inform the auditor’s overall conclusion about whether sufficient appropriate audit evidence has been obtained.” (SAS No. 142, par 5)
The term audit evidence may conjure up images of stacks of source documents (invoices, purchase orders, cheque stubs, etc.) and detailed documentation of ticking and tying them all together in an Excel spreadsheet. But audit evidence isn’t just the outcome of detailed transaction-level testing, it’s more broad and includes the results of your risk assessment procedures and inquiry, any testing of controls, and the results of both detailed and analytical-based substantive testing (SAS-142, par A44).
In other words, the auditor, in exercising their professional judgement as to whether identified risks are properly responded to, has a wide net of support to consider on balance and weighed together to make that conclusion effectively.
So what type of things influence whether evidence is sufficient and appropriate? This comes down to how much evidence is required to respond to the identified risks of material misstatement, and how relevant and reliable that evidence is. The appendix to the standard specifically includes a number of examples and contemplation of what these key terms mean in practice and some of our takeaways (not exhaustive) include:
- What types of factors impact the reliability of audit evidence?
- Source
- Is the information from an external source, and therefore less susceptible to management bias (SAS-142, par A22)?
- Nature
- Is the evidence “documentary” vs. provided orally through inquiry?
- The controls over the information and how it’s produced
- How automated is the process by which data is generated and what is the relative strength of controls that the entity has in place? How is the accuracy and completeness of the information ensured?
- Authenticity
- Has a specialist been involved in validating certain assumptions?
- Source
- What types of factors impact the relevance of audit evidence?
- The accounts and assertions it relates to
- Does the evidence tie directly to identified risks at the assertion level of an account? For example, purchase documents matched to payable transactions right before balance sheet date provides evidence against an early-cutoff risk but not a late-cutoff risk.
- The time period it pertains to
- Does the evidence relate to the period under audit or specific subsets of that period where risk is relevant?
- Susceptibility to bias
- How much influence over the information does management have?
- The accounts and assertions it relates to
These concepts are critical to keep top of mind as we consider the role of data analytics and automation because introducing technology to the audit process doesn’t diminish the auditor’s overall objective and requirement to obtain sufficient and appropriate evidence to support their opinion. Rather, the tests and techniques that we’ll review enable the auditor to more efficiently gather, interpret, and perhaps even generate the evidence that satisfy these criteria.
Facilitating high-quality and data-rich analytical procedures and risk assessment
Let’s consider the following excerpt from the new standard:
A59. Analytical procedures consist of evaluations of financial information through analysis of plausible relationships among both financial and nonfinancial data. Analytical procedures also encompass investigation as necessary of identified fluctuations or relationships that are inconsistent with other relevant information or that differ from expected values by a significant amount. Audit data analytics are techniques that the auditor may use to perform risk assessment procedures…
A60. Use of audit data analytics may enable auditors to identify areas that might represent specific risks relevant to the audit, including the existence of unusual transactions and events, and amounts, ratios, and trends that warrant investigation. An analytical procedure performed using audit data analytics may be used to produce a visualization of transactional detail to assist the auditor in performing risk assessment procedures….
Automated techniques such as the ones described in the guidance can be a very powerful and efficient method to assess relationships across the financial ledger. Having this type of analysis “out-of-the-box” at your fingertips, without detailed scripting or manual data wrangling, promotes efficiencies as well.
Here are a few examples of how the capabilities of MindBridge Ai Auditor align with a technology and data-driven analytical review and risk assessment that the standard explains.
Trend analysis
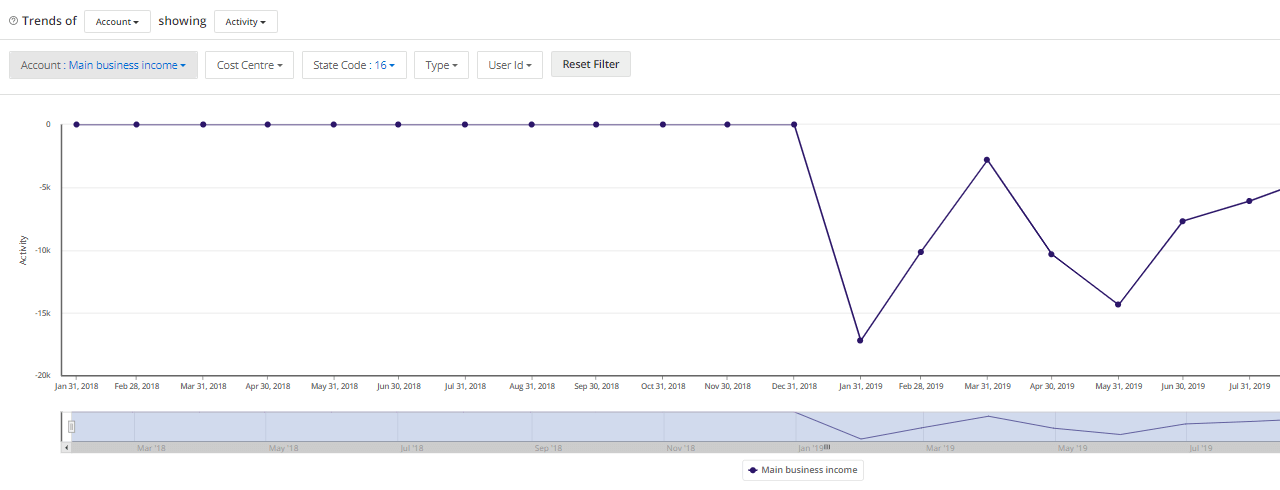
Our Trending analysis allows you to visually compare how one or more accounts moves over time. This allows you to assess how accounts or financial statement areas that you expect to be correlated (accounts receivable and revenue, revenue and costs of sales, etc.) are indeed tracking consistently. It’s important to note that this analysis is available on a monthly basis and is not just a simple year-over-year comparison. This empowers you to have a more nuanced view of what these relationships look like seasonally and more broadly.
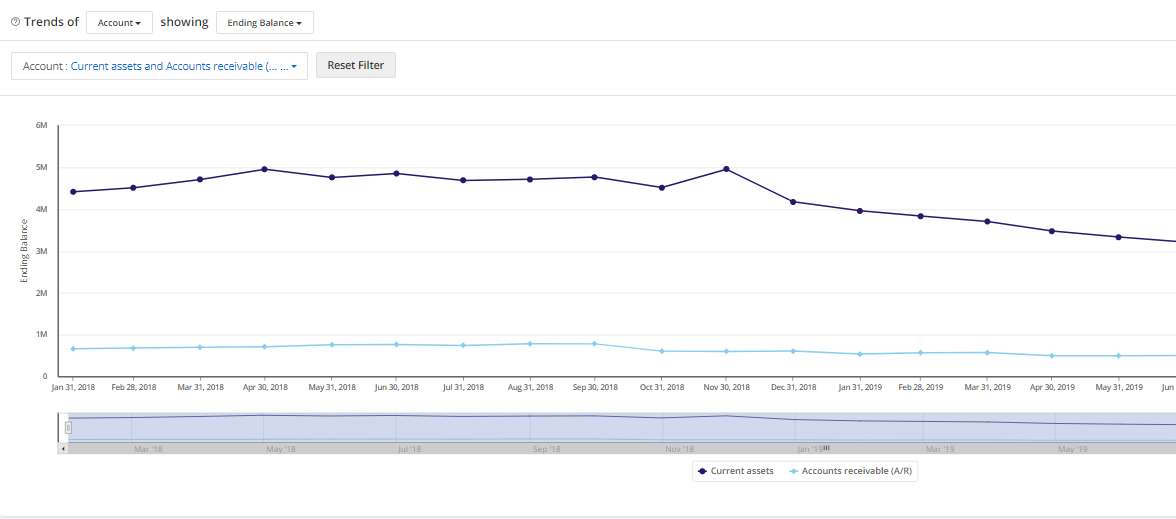
You are also able to layer in filtering of the trends you are seeing, across additional operational dimensions of the financial ledger. For example, if an organization manages it’s P&L by department or region, you can examine how revenue breaks down across one or more of these dimensions with one click.
Ratios
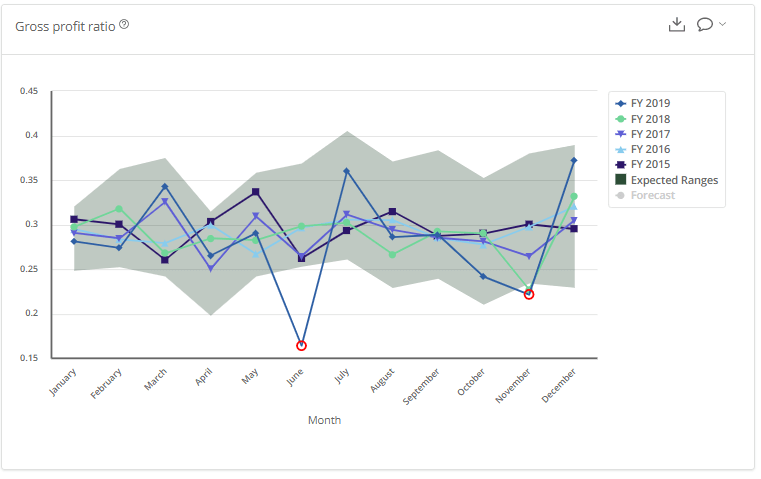
Over 30 critical ratios are automatically calculated by Ai Auditor and the results are visualized on a monthly basis throughout the audit period. How each ratio trends in the current period against prior periods is readily apparent and points of deviation can be flagged for further investigation with your client.
With an appropriate amount of prior period data available, Ai Auditor performs a regression analysis called seasonal autoregressive integrated moving average (SARIMA) to graphically visualize the expected ranges for the ratio in the current period in addition to the trend lines. This is extremely valuable in identifying algorithmic outliers for further audit procedures and input to risk assessment.
Transaction-level analysis
The new standard specifically contemplates how unusual transactions or events in the financial ledger impact risk assessment and this aligns perfectly with Ai Auditor’s core competency of an ensemble-based AI algorithm that runs against every transaction and tags it with a single risk score:
A61. Analytical procedures involve the auditor’s exercise of professional judgment and may be performed manually or by using automated tools and techniques. For example, the auditor may manually scan data to identify significant or unusual items to test, which may include the identification of unusual individual items within account balances or other data through the reading or analysis of entries in transaction listings, subsidiary ledgers, general ledger control accounts, adjusting entries, suspense accounts, reconciliations, and other detailed reports for indications of misstatements that have occurred. The auditor also might use automated tools and techniques to scan an entire population of transactions and identify those transactions meeting the auditor’s criteria for a transaction being unusual…
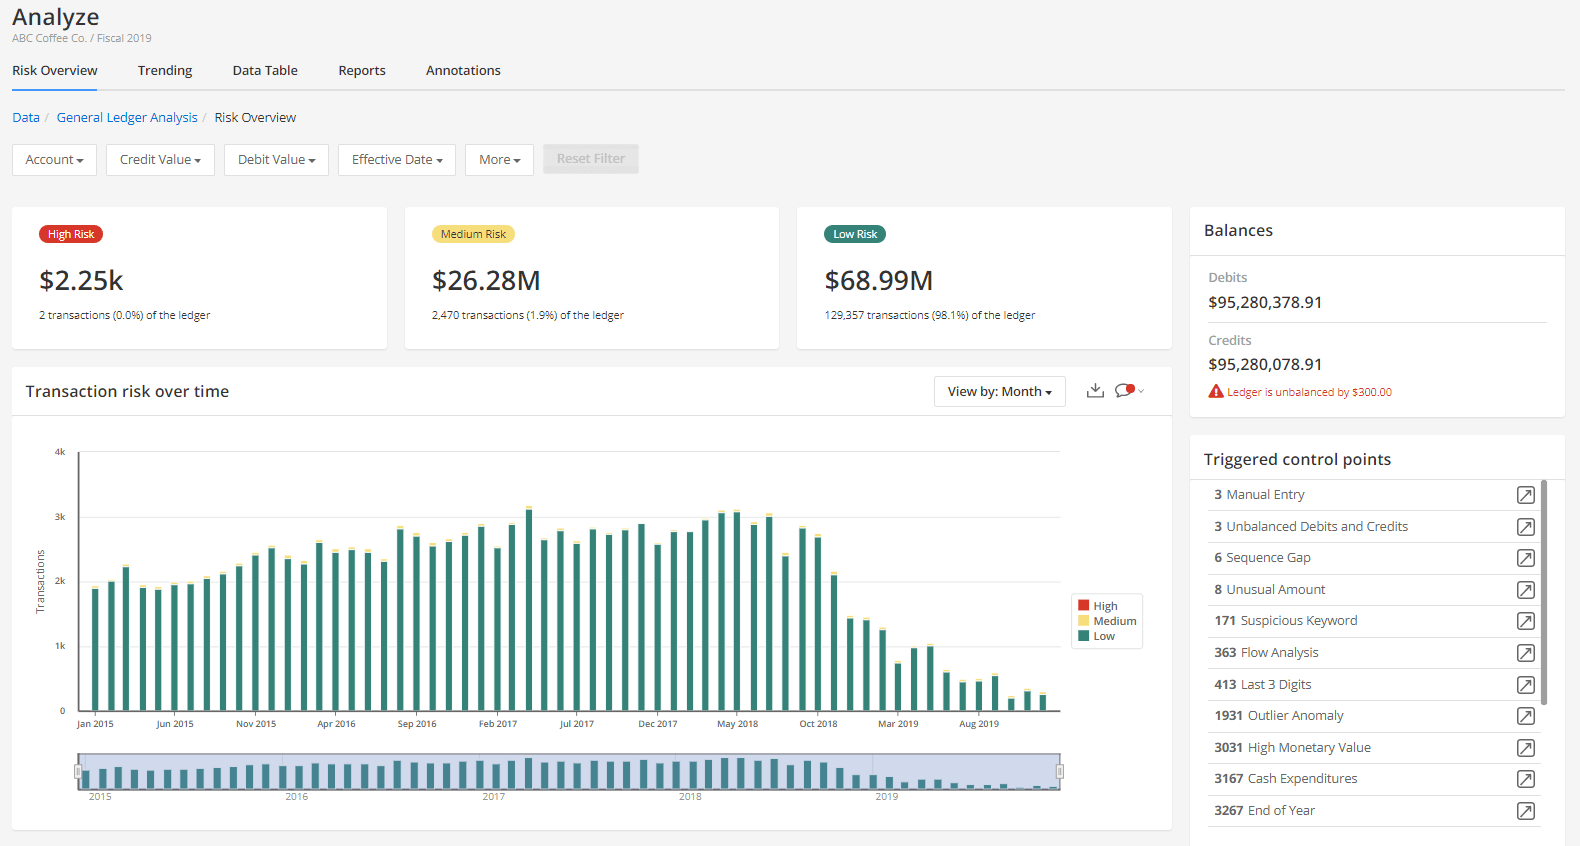
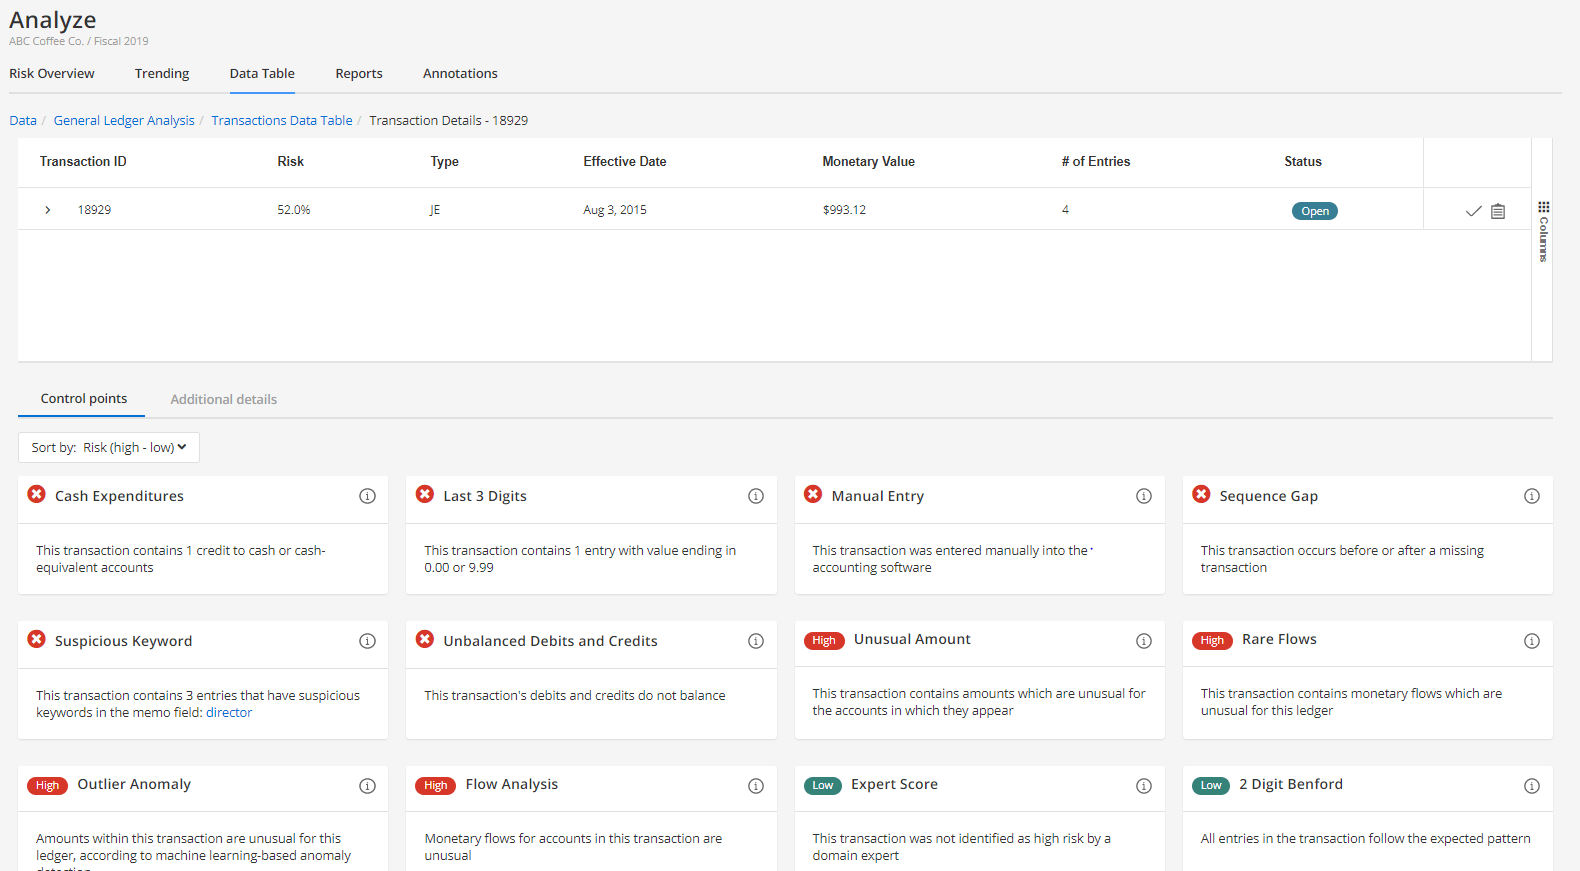
In Ai Auditor, the ensemble-based algorithm includes over 30 different tests, termed Control Points, which range across rules-based, statistical methods, and machine learning-based techniques. The ensemble specifically includes tests for Unusual Amounts posted to an account, Rare Flows of money between accounts that don’t normally interact, and Outlier Anomalies.
With Ai Auditor, you can visualize the results of these tests in aggregate via dashboarding and drill down to the most granular level of a particular entry to see which Control Points are contributing to a certain score.
Techniques that facilitate highly efficient “dual-purpose” procedures
The new standard includes an illustrative example where a series of audit data analytical techniques are used as both a risk assessment procedure and a substantive procedure:
A46. An auditor may use automated tools and techniques to perform both a risk assessment procedure and a substantive procedure concurrently. As illustrated by the concepts in exhibit A, a properly designed audit data analytic may be used to perform risk assessment procedures and may also provide sufficient appropriate audit evidence to address a risk of material misstatement.
The exhibit being referred to in the passage above is quite compelling and certainly worth a detailed review (beginning at page 42 here). As an extension of the previous discussion around transaction-level risk scoring, assuming that additional considerations are satisfied, such as the effectiveness of controls over how the information is produced and the auditor’s confidence as to the accuracy and completeness of the information, the ability to “profile” transactions into relative risk buckets using an audit data analytic (ADA) routine is explicitly contemplated here.
If the results of that “profiling” can be used to not only to inform risk but also the nature, timing, and extent of further substantive audit procedures, the investment into building and integrating these types of techniques into your methodology could provide significant ROI in terms of execution efficiencies.