Our latest release of MindBridge Ai Auditor introduces brand-new support for subledgers, enhanced ingestion workflow, an upgraded user interface, and more. Read on to find out what you can accomplish in this release!
New user experience
We’re proud to unveil a new, modern interface for Ai Auditor that has a stylish look and feel and brings enhanced accessibility with a WCAG 2.0-compliant color palette. To make navigation and access to functionality as easy as possible, we’ve updated the user interface (UI) to a new sidebar that offers a cleaner look and exposes controls that are in context and on demand.
This sidebar can be opened and closed as you need it, and updates dynamically as you work with various capabilities within Ai Auditor. The same space on the screen is used differently depending on the context, making the overall layout cleaner and relevant to what you’re doing.
Subledger support for accounts payable and accounts receivable
The analysis of accounts payable (AP) and accounts receivable (AR) to date has been focused on datasets containing two-sided transactions to determine transaction flows between accounts. This release of Ai Auditor adds the ability to ingest and analyze single-sided subledger information to calculate risk at the financial line-item level.
This enhances your ability to assess risk using data-driven insights and provides trends for the vendor and customer balances to identify significant changes.
Risk overview dashboard
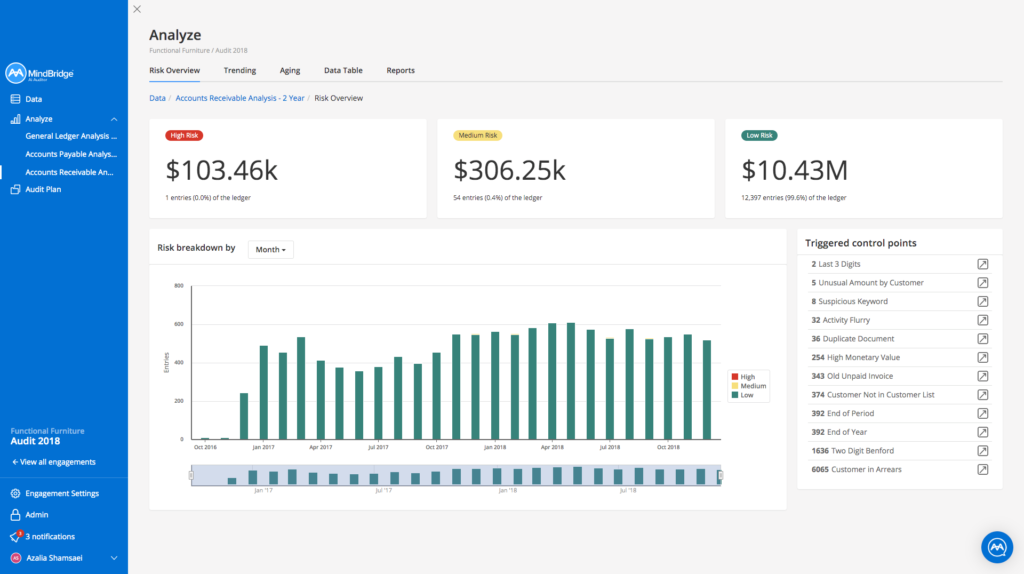
This dashboard contains the key metrics to provide an overview of the risk areas. You can immediately identify notable entries and focus attention on those that pose a heightened risk of misstatement or error.

Ai Auditor uses a combination of rules-based, statistical, and artificial intelligence Control Points to analyze entries in sub-ledgers and put them into buckets: high risk, medium risk, and low risk.
To provide detailed analysis on subledger-specific anomalies and risks, we’ve added new Control Points such as old unpaid invoices and unusual amounts by vendor and customer. We’ve also tweaked some existing Control Points to support single-sided AP and AR subledgers.
Trending dashboard
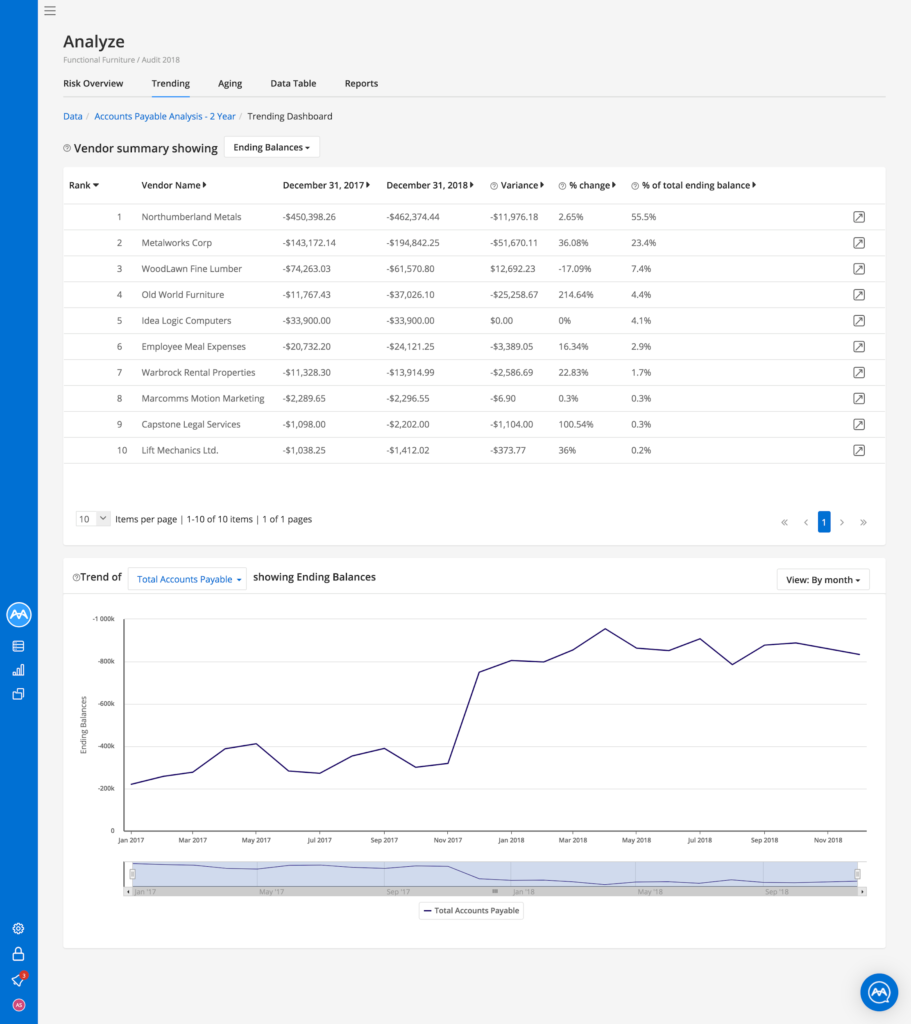
This dashboard contains a summary view of the top outstanding vendors (AP) and customers (AR), including a comparison of all balances to previous periods to determine any significant or unusual changes. You can filter the page by ending balance or total activity.
In the table below, you can see which customers or vendors require attention by looking at the balances.
Vendors or customers are ranked in order of the current year’s ending balance. Vendors or customers that didn’t exist in previous years will be marked as new.
You can see the change in dollar value between the prior and current year’s ending balance in the variance column and % change and % of total balance. To see what entries make up your current balance with each vendor or customer, you can drill down on the entry in the table to land on the Data table page which has the entries detail.
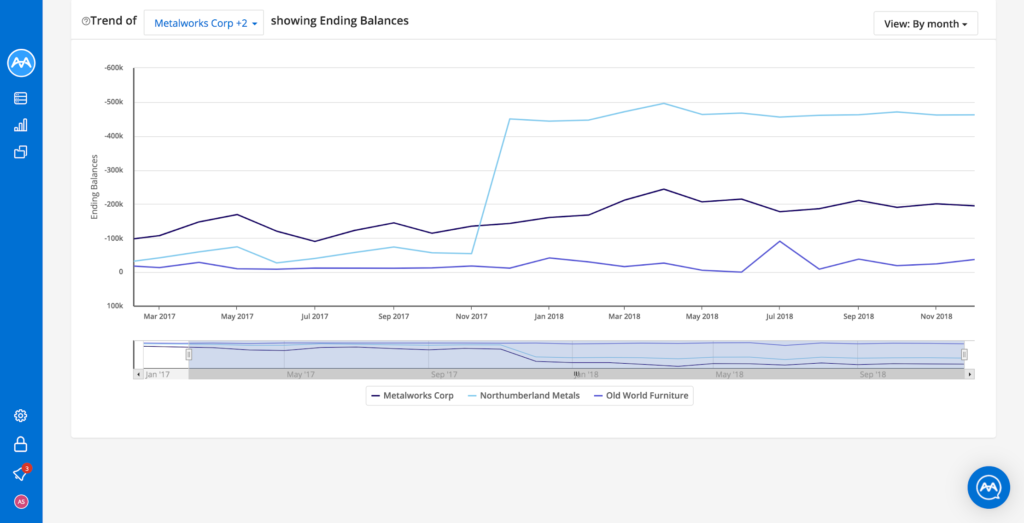
As illustrated below, you can gain a full understanding of the period-over-period changes by exploring vendors or customers on the accounts receivable side by month, quarter, and period. You can compare multiple vendor or customer balances by selecting multiple vendors/customers from the dropdown list.
You can also zoom into time periods of interest using the slider.
Aging dashboards
These dashboards contain metrics that help you to view each vendor/customer, the amount they are owed, and the amount of time they have been owed.
Based on these dashboards, you are able to:
- Recreate the aged AP or AR reports to compare to reports provided by the client.
- Understand the historical distribution of AP or AR balances to identify anomalies.
- In the AP analysis, identify old invoices outstanding to understand potential cash flow issues or misstatements in vendor balances.
- In the AR analysis, identify outstanding invoices to determine appropriateness of allowance for doubtful accounts.
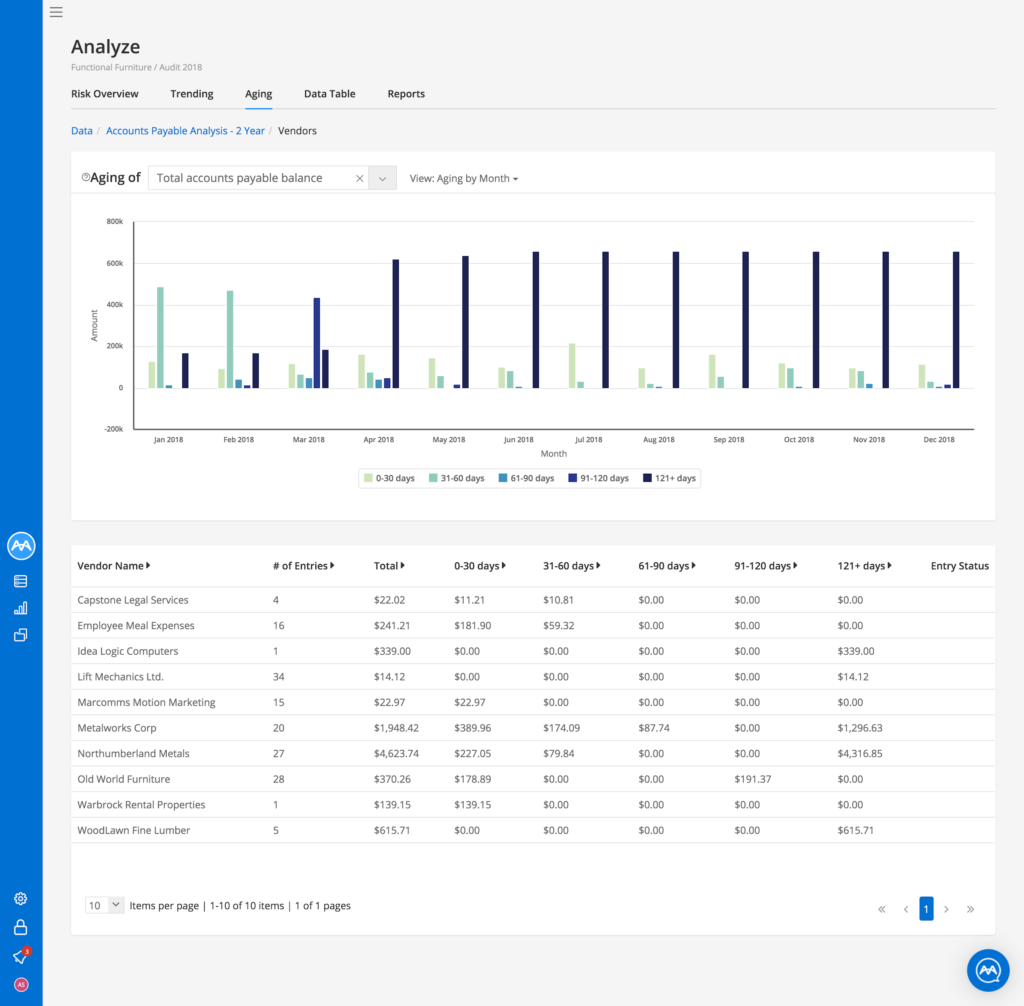
The Aging graph allows you to view the amount of money owed to each vendor/customer, and the amount of time that money has been owed. You can view either the total vendor/customer balances or the balances of specific ones. Time can be displayed by month, quarter, or period.
The Aging table allows you to find out the details on each vendor or customer and whether they were excluded from the aging visualization due to missing data.
Data table
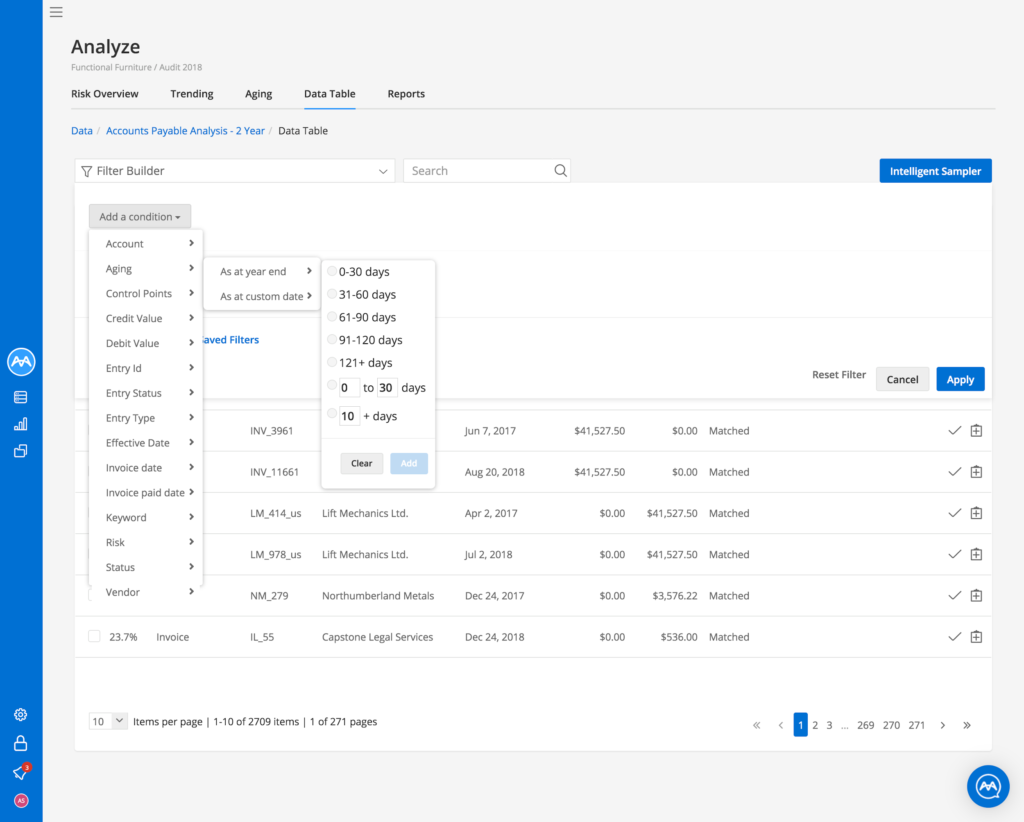
You can use the data table and Filter Builder to select the population of entries in the subledger to meet desired criteria and build tests.
Reports
Ai Auditor generates vendor and customer aging detail summaries that list individual invoices, credit notes, and over-payments owed for each vendor or customer, and how long these have gone.
Enhanced ingestion workflow
As our navigation updates continue to improve the experience, this release also brings enhancements to the data ingestion workflow.
The updated Data page (shown below) guides you through each step of the ingestion process. Since uploading different datasets unlocks different analytical capabilities, we list the features along the right side of the page. Clicking a feature will reveal the required dataset(s) for each.
With the new design, we also give you more freedom when importing files. You’re no longer required to upload the current year’s financial data before uploading any previous year(s) to the analysis.
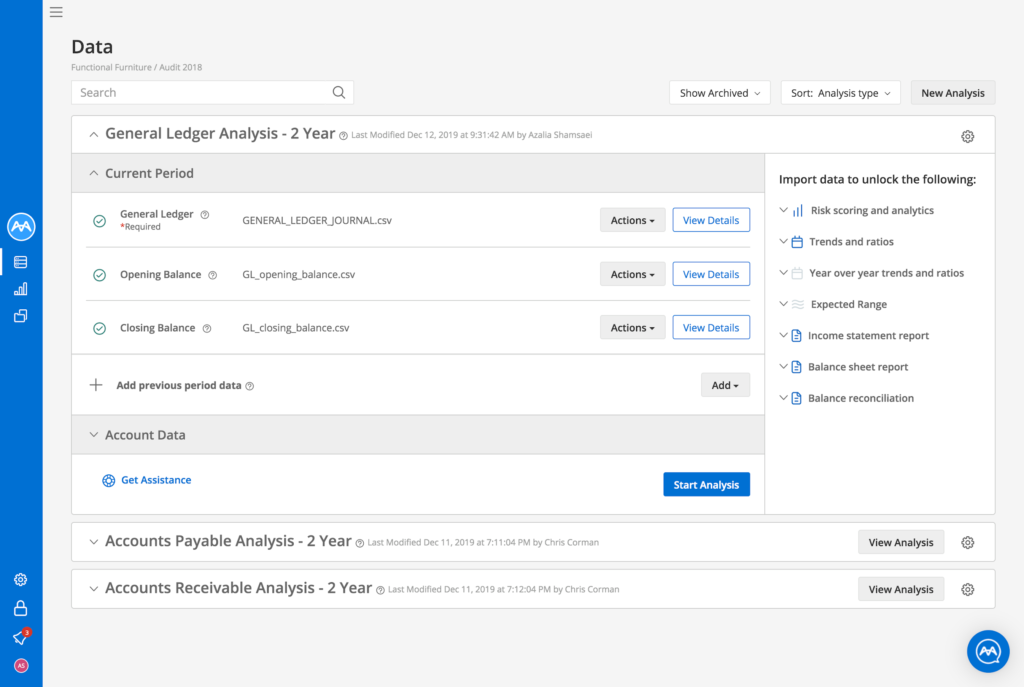
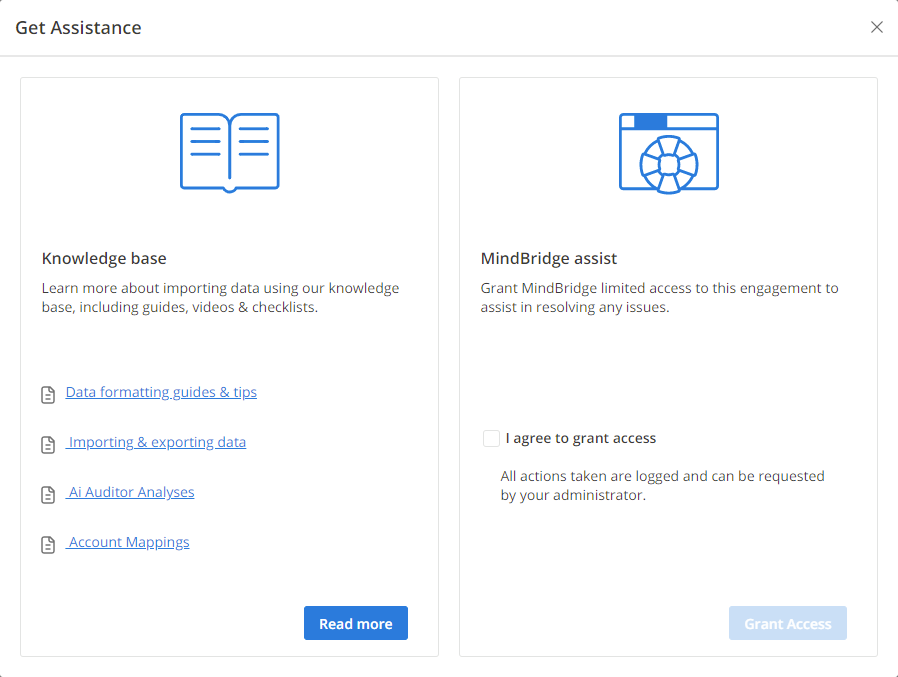
You can get assistance when uploading files by clicking on the Get Assistance button. This gives you access to articles in our knowledge base and to MindBridge assist to contact the MindBridge customer success team to help resolve any issues.
