In times of great uncertainty, we all look for a crystal ball.
Also known as an orbuculum or crystal sphere, legend has it that a crystal ball is a fortune-telling object. But the use of crystal balls to predict the future is pseudoscience and there’s no evidence that they can validly predict the future.
Time and again, businesses and their advisors have proven that monitoring key performance indicators and ratios can be helpful to understand current business health and, some might say, predict future events. With the advent of artificial intelligence and machine learning, we now have the ability to augment this work with large amounts of data and perform complex calculations using an unprecedented number of variables to increase its accuracy.
MindBridge Ai Auditor gives this power to auditors, helping to evaluate financial health, discover trends in risk, and enabling better decision making.
Here’s a quick rundown on some ratios within Ai Auditor and how they can help.
Current ratio
The current ratio is a liquidity ratio used to evaluate a company’s ability to meet its short-term debt obligations by measuring the adequacy of the company’s current resources to cover its debt. To calculate, you divide current assets by current liabilities.
Companies in crisis will likely see their current ratio decrease as they draw down lines of credit to stockpile cash and use cash to maintain operations while revenue and accounts receivable decline. An example is Boeing drawing down its full $13.8B line of credit to stockpile cash to maintain operations and deal with the damage the airline industry is experiencing.
A healthy company has a current ratio of more than 2, whereas a company who is in trouble has a current ratio of less than 1.
Operating cash flow to sales ratio
Even with a healthy current ratio, cash and cash flow must be monitored because of uncertainty on accounts receivable and cash is key to the success and survival of any business. The operating cash flow to sales ratio indicates a company’s ability to generate cash from its sales.
Ideally, as sales increase, operating cash flow should increase by the same. However, in a time of crisis, accounts receivable may take unusually longer to collect as the market manages cash more carefully and takes longer to pay. An example of this ratio decreasing is the difficulty that oil producers across the world are facing as demand for oil plummets, supply increases, and oil companies have a more difficult time generating cash from their sales.
Though it is normal to see change in a period of change, the higher the ratio the better, and it should find a level of consistency over time.
Debt to equity ratio
The debt to equity ratio is an indicator of a company’s financial health. This ratio is indicative of the company’s ability to meet financing obligations as well as its financing structure.
It will be normal in a crisis to see this ratio increase as companies borrow heavily against their lines of credit and other debt. Investors will also be hesitant to provide more equity in a crisis especially as the markets are in decline. Further, raising money via equity offerings at a time of depressed markets is expensive to businesses. This causes companies to rely on debt and since increasing debt brings an increasing ratio, lenders will eventually consider it unhealthy.
This is part of the reason that the Small Business Administration announced additional small business support of up to $2M loans to small businesses who qualify during the coronavirus (COVID-19) epidemic.
A ratio of about 1 is optimal where a ratio higher than 2 is considered to be unhealthy.
Cash flow to debt ratio
Cash flow is king to any business as no business can operate without an ability to pay their bills. The cash flow to debt ratio is often considered the best predictor of financial business failure. This ratio is calculated by dividing cash flow from operations by total debt. A higher ratio indicates a company is more able to cover its debt.
Often free cash flow is used rather than operating cash flow because this takes into account capital expenditures. With COVID-19 essentially grounding international air travel, airlines are seeing a huge decrease in cash flow to debt ratio, so much so that the airlines are seeking a $50B aid package from the US government.
A ratio higher than 1 is healthy but any value below 1 is indicative of an impending bankruptcy within a few years unless the company takes steps to improve its situation.
Another metric often used to predict potential bankruptcy is the Z-score, which is a combination of several financial ratios used to produce a single composite score.
What do these ratios have in common?
Other than the fact that they are in no way associated with crystal balls, they are very important to a business of any size in a time like this and they can be augmented and presented using MindBridge Ai Auditor.
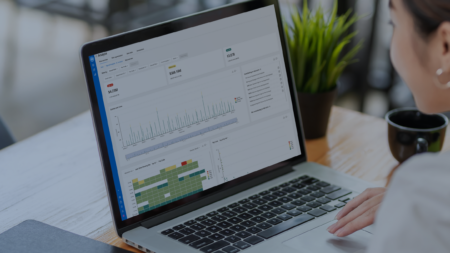
As businesses create plans and seek advice from their advisors, Ai Auditor can present intuitive dashboards of ratios such as these (and more) by using a 100% complete set of general ledger data. In addition, by leveraging machine learning and AI, Ai Auditor can provide analytics of these ratios to evaluate deviations from expected ranges across 12 months of data. Additional analysis is also possible on more detailed ledger data such as accounts payable and accounts receivable ledgers.
So what’s with the crystal balls?
Whereas we have all been led to believe that the future-telling effect of crystal balls is pseudoscience—which very well may be true—there do exist approaches and high-tech tools that enable the use of massive data sets to help gain incremental clarity about the future.
Ai Auditor isn’t pseudoscience, it’s right here, right now.


