

Are you curious about how financial professionals identify and assess anomalies in data? In this webinar recap, we’ll explore “the wild use cases of financial anomaly detection,” which covers not only what a financial anomaly is, but also how artificial intelligence can identify anomalies and what the lack of anomalies in a dataset can indicate. This session dives into real-world examples of when financial professionals have found the least anomalous transaction to be the most interesting, such as in embedded lease completeness testing under ASC 842 and quality of earnings assessments. By the end of this recap, you’ll have a better understanding of financial anomaly detection and how it can help in your financial work.
Session host

VP, Strategy & Industry Relations
MindBridge
Danielle Supkis Cheek is the VP of Strategy and Industry Relations at MindBridge. She is a CPA, CFE, and CVA with a Master’s in Accountancy. She is a 7-time 40 under 40 by CPA Practice Advisor and a 4-time Most Powerful Women in Accounting by CPA Practice Advisor and AICPA. Danielle teaches accounting and data analytics to the Masters of Accountancy (MAcc) students at Rice University.
What is Anomaly detection?
Anomaly detection involves identifying data points that deviate significantly from the norm or expected patterns. And while the terms “outlier” and “anomaly” are often used interchangeably, they have distinct meanings in data science. An outlier is a data point that is only slightly different from the rest of the data, while an anomaly is the most different data point from everything else.
Determining whether a data point is an anomaly or just an outlier can be challenging when there is a lot of noise in the data. To address this issue, it is helpful to identify patterns in the data that are considered normal or expected, as this can provide a baseline for determining what is anomalous.
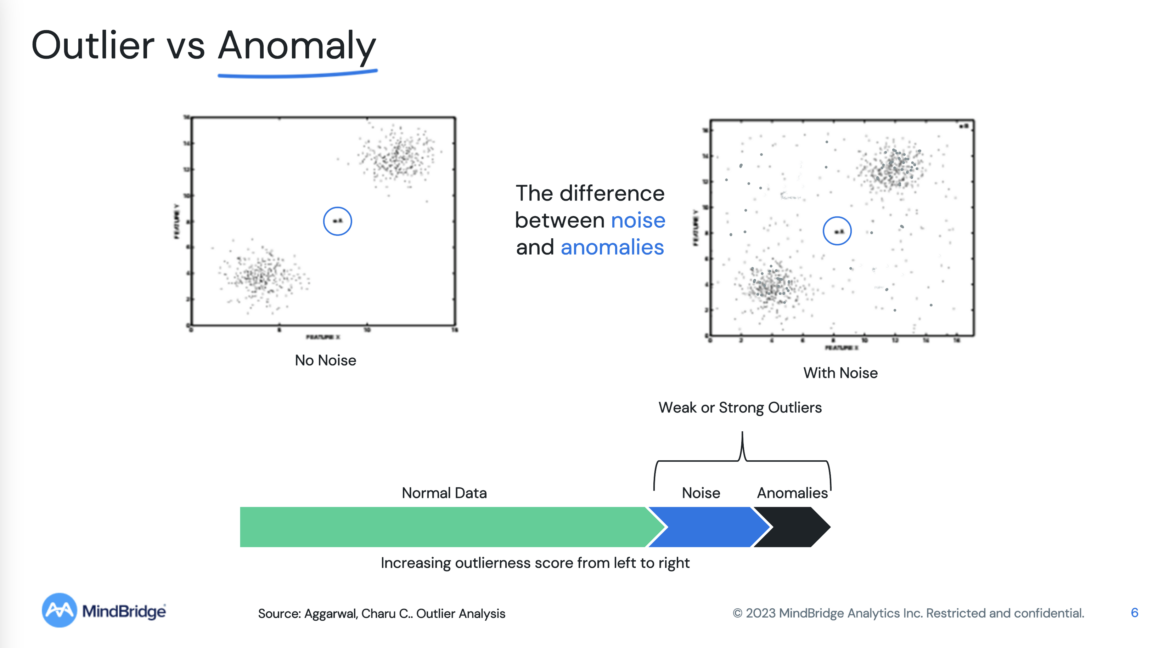
There is much value in understanding the normal data patterns, which can help to identify anomalies and improve anomaly detection algorithms. For instance, the clustering of similar transactions in a ledger can indicate a strong control environment, whereas scattered transactions may suggest a weaker control environment.
Ensemble AI
Ensemble AI is the process of running multiple tests simultaneously to detect and identify differences in data sets. By combining a multitude of tests, an ensemble AI approach can overcome issues with one-off tests, such as being prone to failure and losing dimensionality.
This approach is divided into three categories: traditional rules, statistical methods, and machine learning. When these approaches are used together in an ensemble, the resulting diversity can create better outcomes. With this design diversity, the ensemble becomes better than the sum of its parts.
However, the computational requirements associated with running many tests on large data sets can be complex. The assessment of relationships between different data points requires significant computational power and may result in an enormous number of additional data points.
How anomaly detection is changing what we can know in financial data
The explosion of data has created a new wave of transparency in the industry, driven by the digitization of the finance function. This has changed what is knowable within datasets, eliminating the risk of losing information as physical documents are replaced by digital ones. The concept of what is knowable can be classified into three categories: known knowns, known unknowns, and unknown unknowns. Analyzing known knowns, such as monthly close journal entries, can validate the effectiveness of an analytic approach. Known unknowns, such as financial statement miscodings, offer a high return on investment when detected through specific tests. Unknown unknowns, the most valuable but also the most difficult to find, are not the focus of this presentation.
The digitization of the finance function has been popularized by Robotic Process Automation (RPA) and traditional data analytics approaches like Power BI. However, while organizations and CPA firms have heavily invested in automating work, they have not changed their detective control environment accordingly. This presents a risk of automating something incorrectly or changing the risk profile of what can be anomalous, requiring a redesign of detective controls to detect such anomalies. Anomaly detection can be used to analyze the consistency of transactions and redesign detective controls when changing the risk profile of inbound transactions. It is essential to identify anomalies that may violate processes, even if they do not violate accounting logic.
The value of boring data in financial anomaly detection
The value of boring data lies in understanding patterns and processes over time. Looking at accounting data, there is a normal quarterly cycle that can be seen, with medium and high-risk transactions that are different from each other, as well as infrequent journal entries happening at month-end.
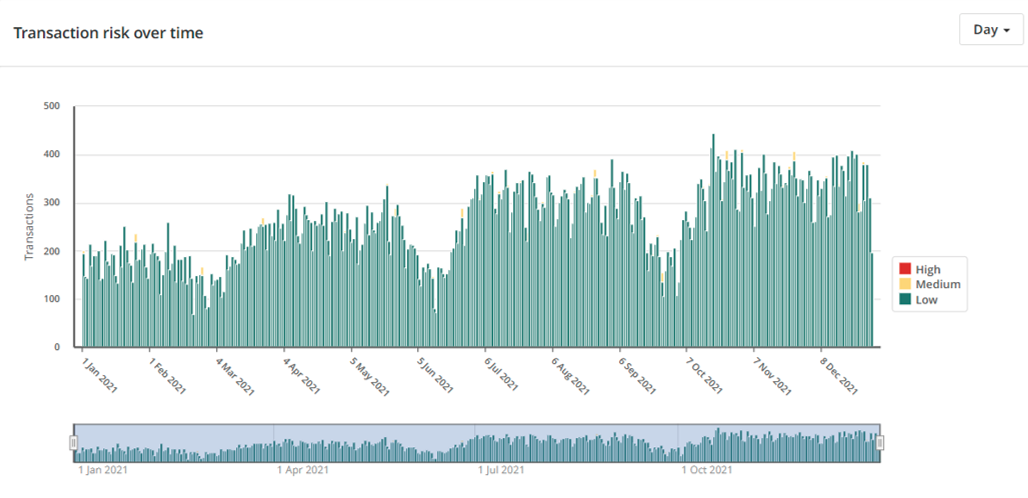
Understanding the time series and frequency of these patterns can validate a particular approach or process, and finding interesting anomalies that match expected behavior can provide assurance that the approach is working. For example, if month-end journal entries were not found, it would be cause for concern. By analyzing and understanding data over time, a better understanding of a particular process or organization can be gained.
Example Use Case: Embedded Leases
Under the new lease standard (ASC 842), all leases will effectively go onto the balance sheet with very few exceptions. This means that all right-to-use assets and liabilities will be listed on the balance sheet.
In the past, you could have an embedded lease in a service contract. For example, an IT service contract might include leased equipment such as routers and firewalls. These types of embedded leased assets were often overlooked, but with the new standard, they will be moved onto the balance sheet, creating an unrecorded liability which can be worse than the past missed disclosure.
To assess vendors for embedded leases using the accounts payable analysis module, assess what is normal for a vendor and identify how different a transaction is from that normal. Order transactions by lowest risk and group by vendor to identify which vendors have the most consistent payment streams (e.g., rental properties and marketing billboards) and thus have the highest risk for an embedded lease.
To identify potential embedded leases, look for consistency in payment streams that can be an indicator that the vendor payment amount is not tied to the operating volume of the business and, therefore, has the highest risk of containing an embedded lease in the contract.
Example Use Case: Quality of Earnings
The next example covers the concept of “quality of earnings” in revenue transactions. Recurring revenues are widely considered to be the most valuable type of earnings, as it is the most consistent.
To identify the most valuable data, find the least anomalous series of transactions to see which ones are the most consistent and therefore have the highest potential for being high-quality revenues. This can be applied to the data in a general ledger, which has become increasingly valuable due to the granularity of data it provides, and the insights that can be derived from it. This is particularly useful in the due diligence process, where a faster understanding of processes can be achieved, leading to more efficient and effective assessments of the quality of earnings.
Transparency / xAI
To cap off the webinar, Danielle discussed the importance of transparency and reliance on tools, particularly in light of regulatory pressures. To achieve these goals, there are three layers of explainability and transparency that are necessary for relying on third-party tools.
The first layer involves third-party validation of key components of the tool, such as ISO certifications, SOX certifications, and technology accreditations. These certifications, which MindBridge has achieved (seen below), provide a base layer of assurance that the tool is reliable and trustworthy.

The second layer involves testing the tool to ensure that it is working as designed. This testing can be done manually or using third-party assurance that the algorithms are working as intended and are low risk for bias. These tests are important for ensuring that the tool is effective and accurate.
The third layer involves using the results of the testing to validate that the approach is working. This is especially relevant in accounting data and operational data sets, where rare and infrequent occurrences that typically have strong preventative controls. By validating that the tool is finding these rare and infrequent occurrences, it provides further evidence that the approach is effective and reliable.
By using third-party validation, testing, and validation of results, organizations can have greater confidence in the effectiveness and accuracy of these tools.
We hope you found this webinar on financial anomaly detection insightful and informative. Don’t forget to join us for our upcoming webinar in March, “Slice and dice with ensemble AI: segment and disaggregated revenue analytics,” where we will continue to explore the exciting ways that AI is revolutionizing the financial industry. Also, be sure to catch up on our previous webinar, “AI meets Internal Controls Over Financial Reporting (AiCFR),” for more valuable insights. Thank you for joining us, and stay tuned for more exciting content!