
ISA 315 (revised) and Data Analytics: Risk assessment procedures reimagined
The revised standard has been published as of December 2020, and you might be wondering what impact it has on your firm’s risk assessment procedures and how you can address the requirements. There are many useful sources of information on the changes, notably the IAASB’s Introduction to ISA 315. IFAC also published a helpful flowchart for ISA 315 during the work programme, which walks through the various steps required to assess risk of material misstatement.
There are a number of improvements to the standard, including an enhanced focus on controls (particularly IT controls), stronger requirements on exercising professional scepticism and documentation, and considerations around the use of data analytics for risk assessment. The new standard comes into effect from 15th December 2021, so now is the time to start planning how you will address the changes in your audit. Below we discuss some key considerations on how analytics can support a strong risk assessment.
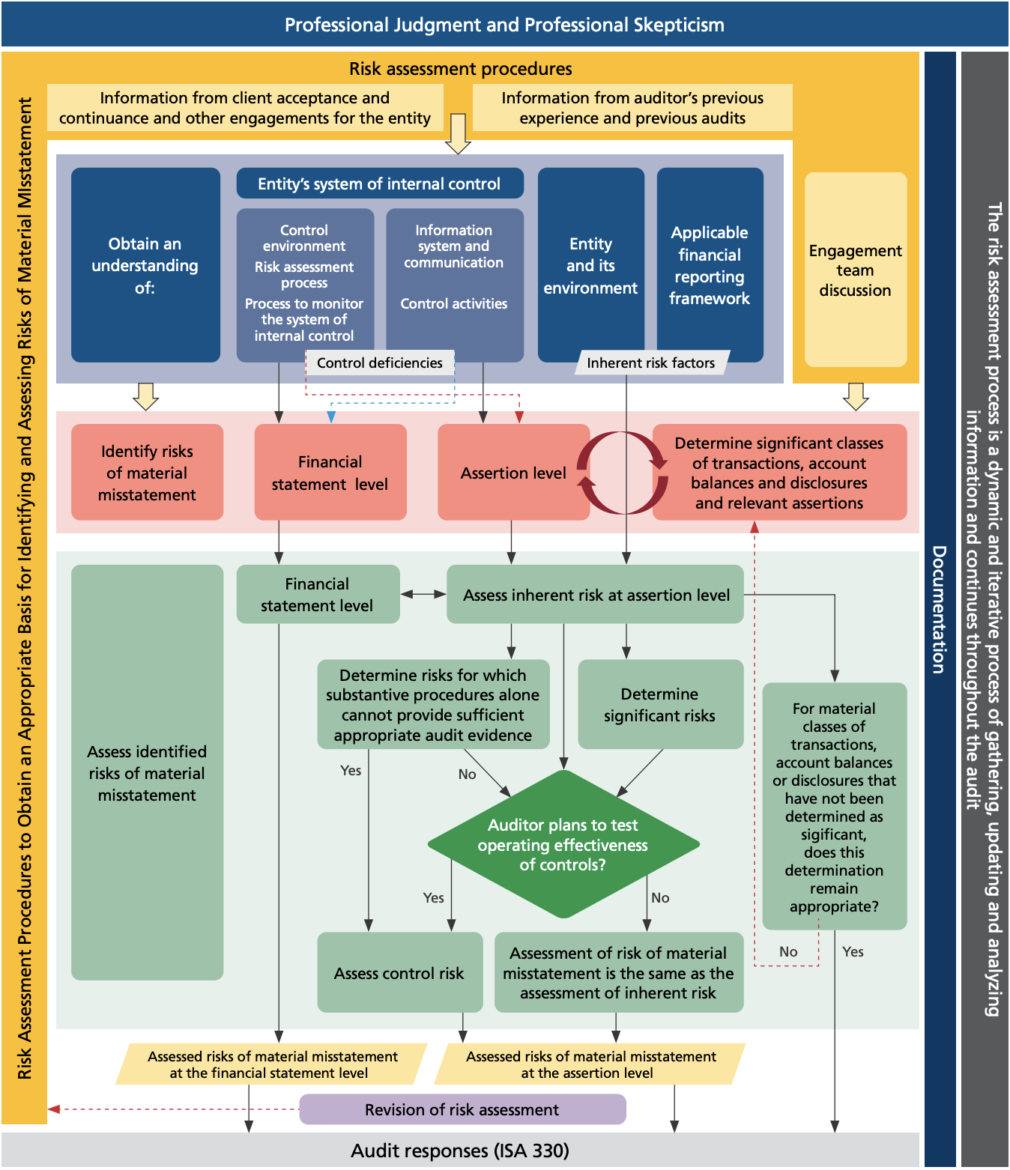
Credit: https://www.ifac.org/system/files/publications/files/IAASB-Introduction-to-ISA-315.pdf
So how can data analytics support your risk assessment according to ISA 315? The areas identified above in red show the different procedures that can be supported by the use of these techniques. A key element of the revised standard is that this should be an iterative process conducted throughout the audit. This means using data analytics tools that can be easily refreshed with the latest information will better support this requirement than more traditional approaches.
Identifying risks of material misstatement at the financial statement level
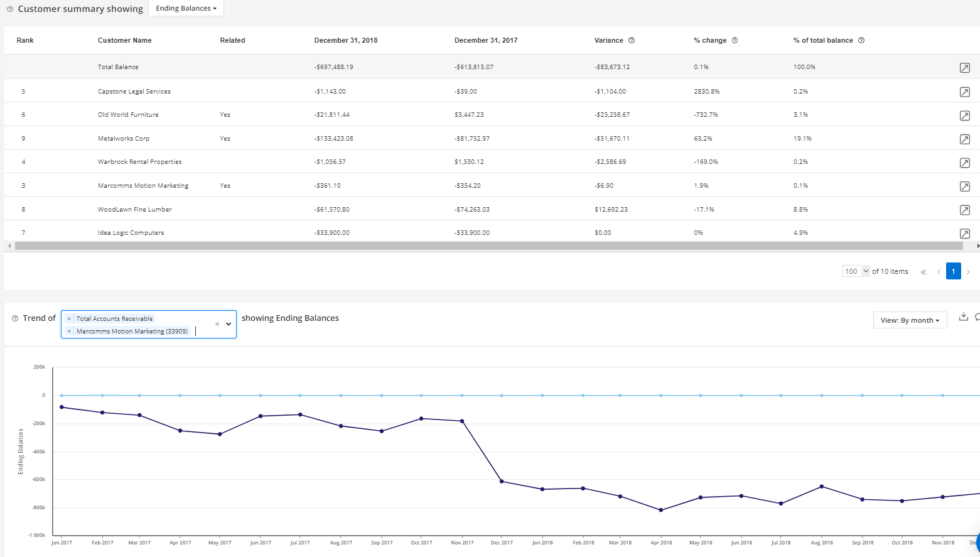
Data analytics can support the risk assessment procedures laid out in ISA 315 by analysing previous and current accounting data to the financial statement level. This allows the auditor to see the material balances in the accounts, and if machine learning is applied, where the concentration of risky transactions lies. This is where the knowledge gained in the blue boxes above can be brought to bear. Comparing understanding gained through observation to the data is a powerful way to sense check and identify areas for further investigation.
Identifying risks of material misstatement at the assertion level
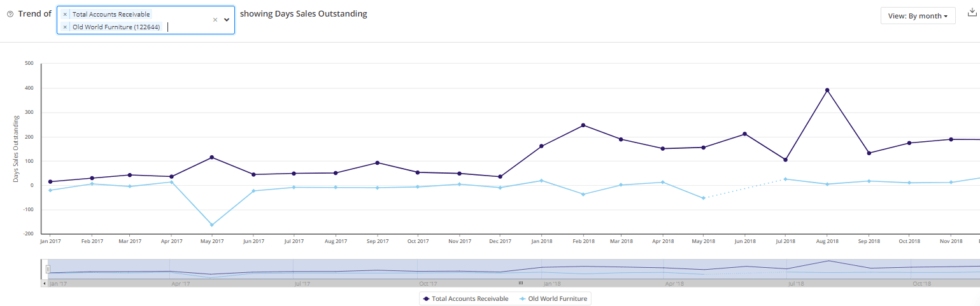
Specific analyses can target assertion risks and show where there are particular problems with an assertion. To do so effectively, several different analytics tests can be applied and combined to develop a good indicator of an assertion risk, for example accuracy. These can then be applied in an automatic way to give the auditor the information needed for their risk assessment.
Determine significant classes of transactions, account balances or disclosures (COTABD)
Combining assertion analytics with the ability to profile similar transactions can help auditors identify significant classes of transactions or balances. Analytics can help to produce similarity scores, but also to identify sets of transactions that are unusual. This can indicate previously unknown business processes that may require a separate assessment of their control environment.
Assess inherent risk by assessing likelihood and magnitude
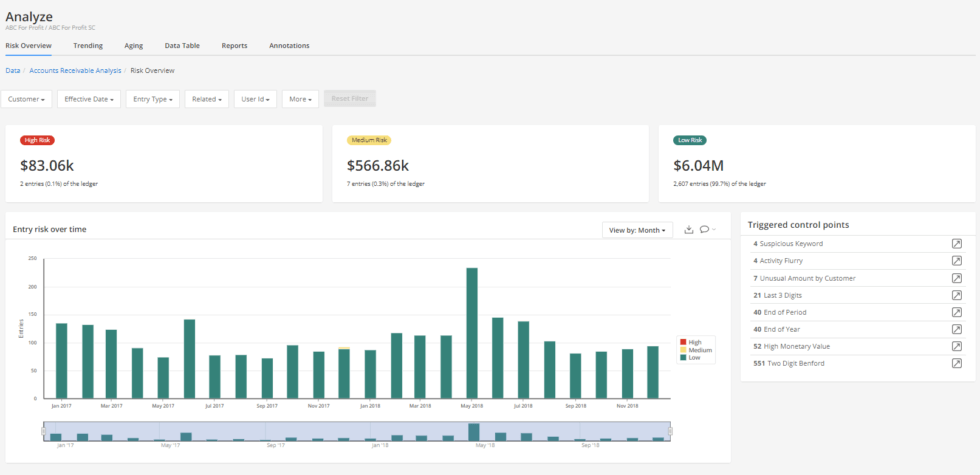
Following identification of risk, the audit can guide their assessment by understanding the level of unusualness. Data analytics can provide finer grain evaluations of risk rather than simply risky or not. This can help support assessments aligned with the spectrum of inherent risk as defined in the standard.
Assess control risk
Data analytics such as process mining or automated testing of segregation of duties can help to inform or test control risk. These analytics can provide more comfort around the controls risk assessment and help to identify deviations in the control environment that require further examination.
Material but not significant COTABD
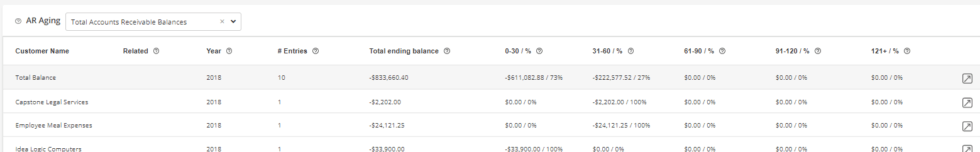
Where COTABD has been determined as material but not significant, recurring analytics can ensure that this assessment remains valid. Anomaly detection methods can be particularly helpful here, allowing the auditor to regularly check that nothing unusual has occurred since the initial assessment was undertaken.
Next Steps: ISA 315 and Data Analytics
Audit methodologies will need to reflect the revised workflow, with particular emphasis on the iterative nature of the risk assessment and ensuring that auditors are prompted to exercise professional scepticism and document it at every stage. Data analytics can help to ensure that the information used to continuously conduct risk assessment is timely, appropriate and relevant.
These improvements to the standard will result in a stronger audit approach and an advancement towards industry adaption data and analytics technologies. With AI audit software, accountants and auditors can gain deeper insights into their client’s financial data, in less time. Overall, the audit software can increase the efficiency of their processes, so they can focus on delivering better results, in time for the ISA 315 (revised) December 15th, 2021 deadline.