Introducing the MindBridge Developer Portal 

Explore the MindBridge Developer Portal with APIs, SDKs, and templates to integrate financial oversight into ERP, GRC, BI, and data platforms.

Financial systems were not designed to operate continuously. They were built around cycles, checkpoints, and human review, but that model is breaking. As finance becomes more automated and execution accelerates, the controls designed to govern it are falling behind. What used to be reviewed periodically now unfolds continuously, creating a governance gap where oversight remains periodic, reactive, and sample-based.  To help teams address … Read more

Fast, Clear, and Actionable: A Reimagined Approach to Financial Risk Intelligence 

Financial professionals are inundated with vast amounts of data, making it increasingly difficult for teams to sift through information and identify areas of concern. Our users want a solution that doesn’t just show them the data, they want to be told exactly where risks are lurking and how to act on them. Traditional methods, even … Read more

Revolutionizing accounting oversight: MindBridge’s next-generation anomaly detection 

The accuracy of financial data is not just an operational need but a strategic imperative. Clean financial data is crucial for reliable financial analysis, accurate reporting, and sound decision-making. Finance teams need to be the trusted source of truth. This allows the business to maintain consistent compliance, manage risks, and optimize performance in business operations … Read more

MindBridge launches new advancements with its latest release in 2022

Leading next-generation data anomaly and risk detection for financial data. Read more in the Press Release published here. While it’s true that there’s nothing more constant than change, in today’s financial markets, this piece of wisdom could not be more accurate. With the growing volumes of data, increasing complexities of multinationals, and the ongoing march … Read more

New Ai Auditor release: December 2019

internal auditor role

Our latest release of MindBridge Ai Auditor introduces brand-new support for subledgers, enhanced ingestion workflow, an upgraded user interface, and more. Read on to find out what you can accomplish in this release!

New user experience

We’re proud to unveil a new, modern interface for Ai Auditor that has a stylish look and feel and brings enhanced accessibility with a WCAG 2.0-compliant color palette. To make navigation and access to functionality as easy as possible, we’ve updated the user interface (UI) to a new sidebar that offers a cleaner look and exposes controls that are in context and on demand.

This sidebar can be opened and closed as you need it, and updates dynamically as you work with various capabilities within Ai Auditor. The same space on the screen is used differently depending on the context, making the overall layout cleaner and relevant to what you’re doing.

artificial intelligence in accounting

Subledger support for accounts payable and accounts receivable

The analysis of accounts payable (AP) and accounts receivable (AR) to date has been focused on datasets containing two-sided transactions to determine transaction flows between accounts. This release of Ai Auditor adds the ability to ingest and analyze single-sided subledger information to calculate risk at the financial line-item level.

This enhances your ability to assess risk using data-driven insights and provides trends for the vendor and customer balances to identify significant changes.

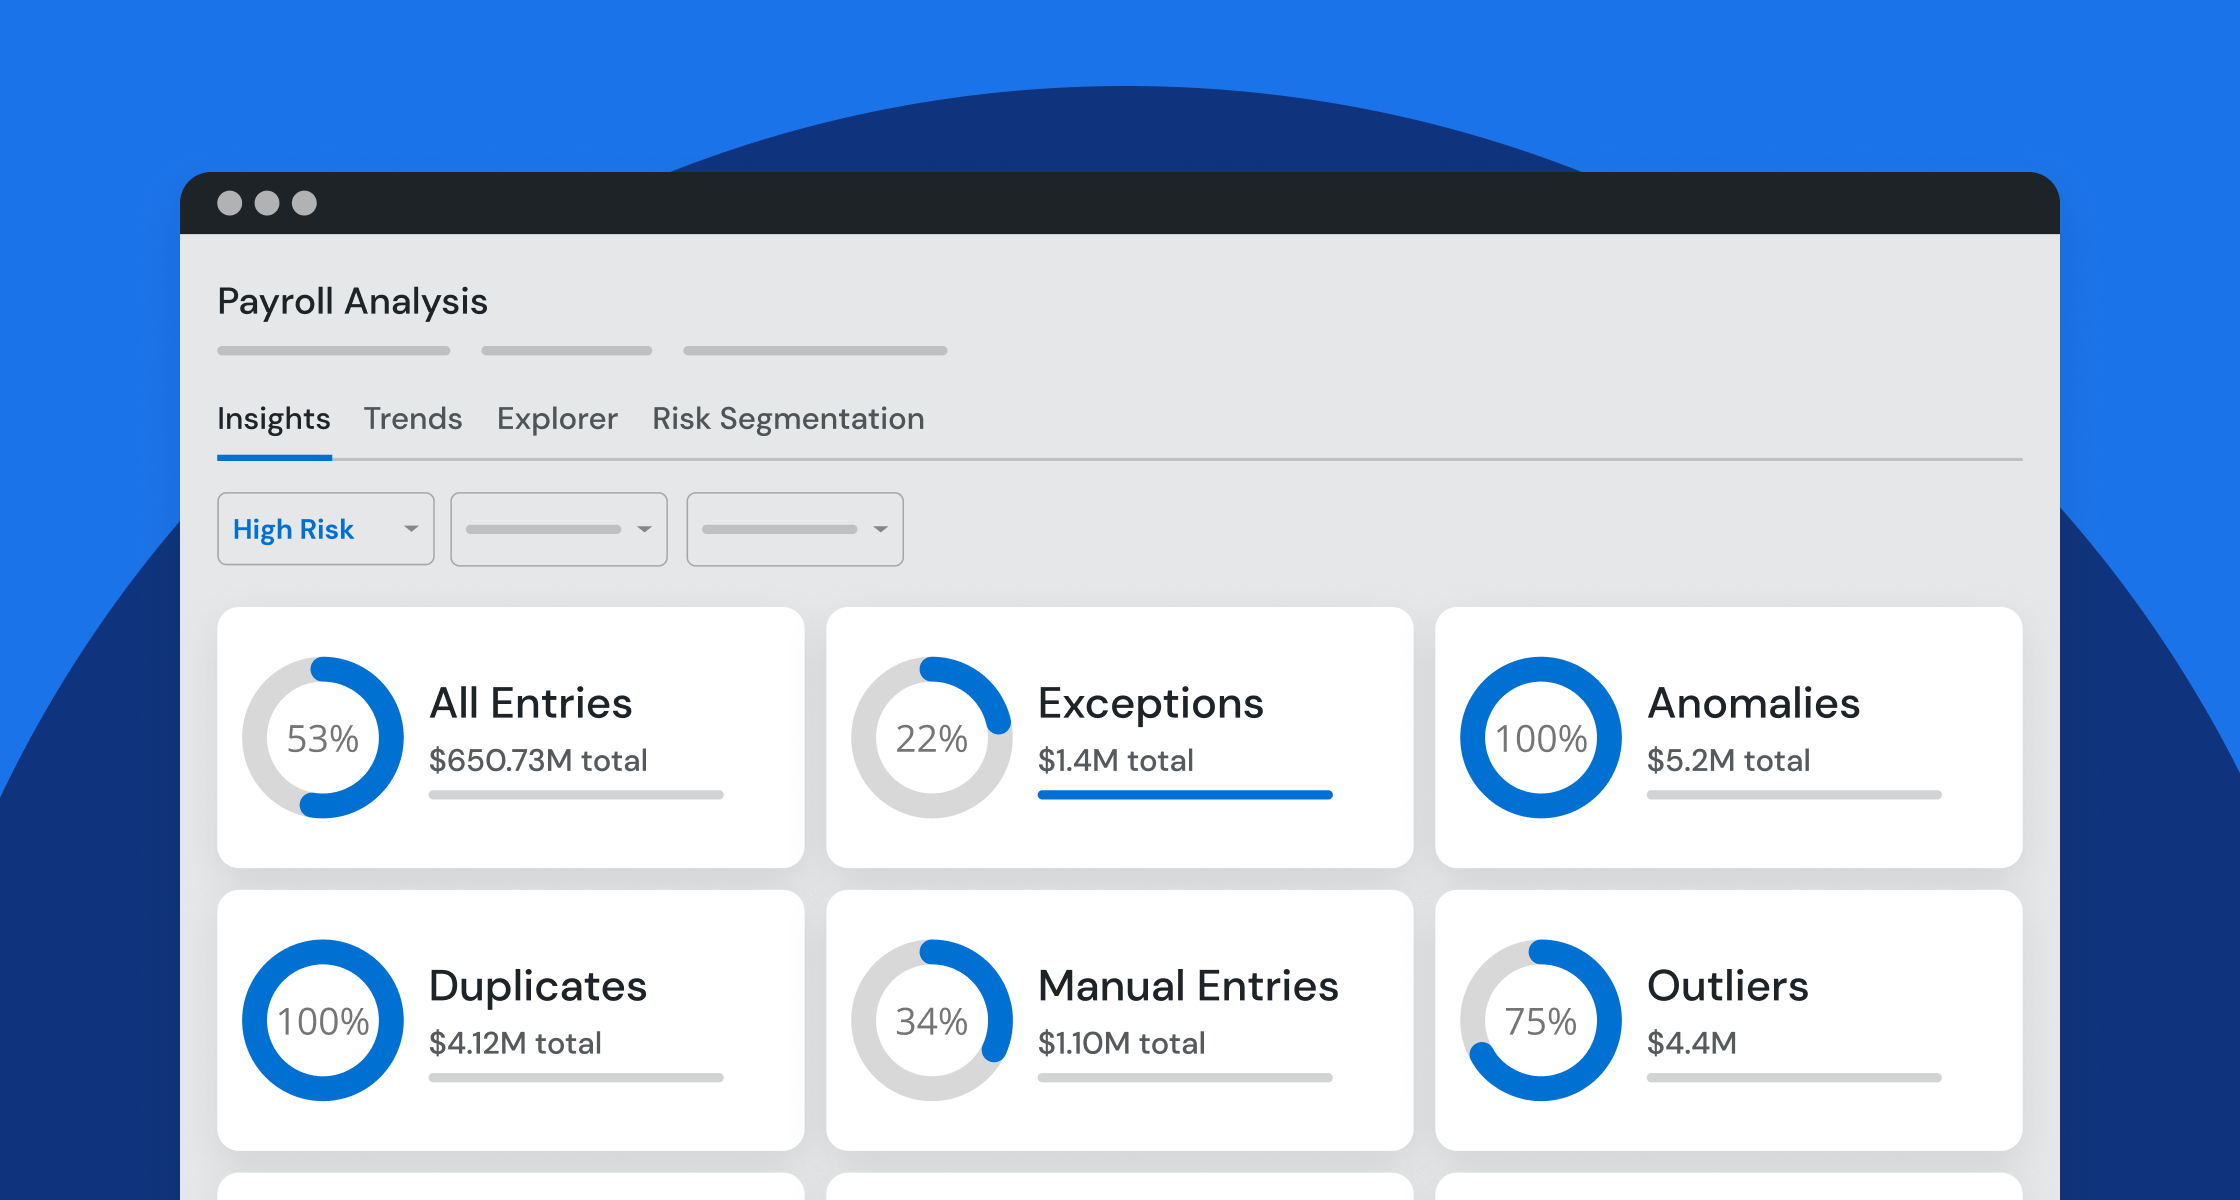
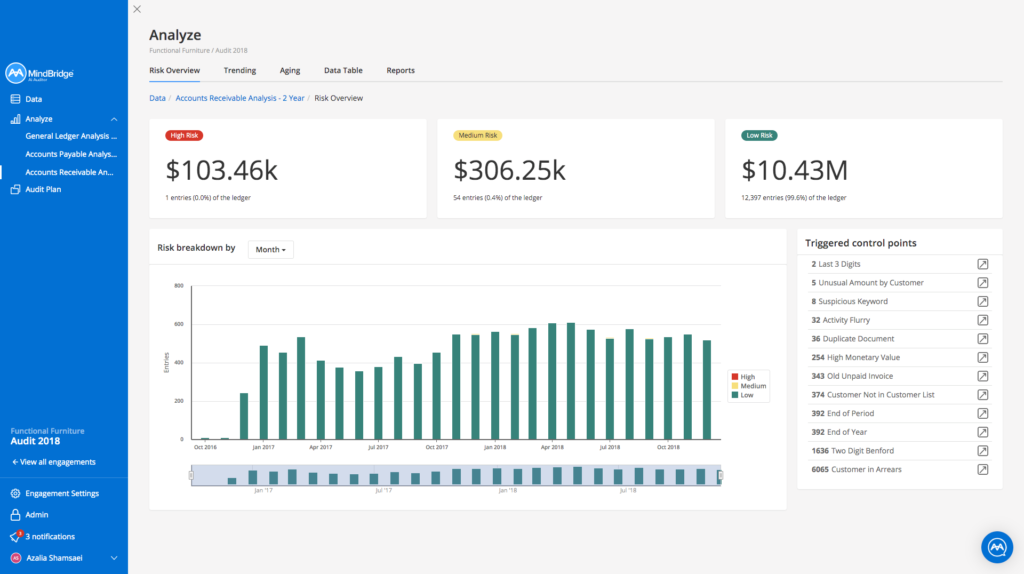
Risk overview dashboard

This dashboard contains the key metrics to provide an overview of the risk areas. You can immediately identify notable entries and focus attention on those that pose a heightened risk of misstatement or error.

artificial intelligence in accounting

Ai Auditor uses a combination of rules-based, statistical, and artificial intelligence Control Points to analyze entries in sub-ledgers and put them into buckets: high risk, medium risk, and low risk.

To provide detailed analysis on subledger-specific anomalies and risks, we’ve added new Control Points such as old unpaid invoices and unusual amounts by vendor and customer. We’ve also tweaked some existing Control Points to support single-sided AP and AR subledgers.
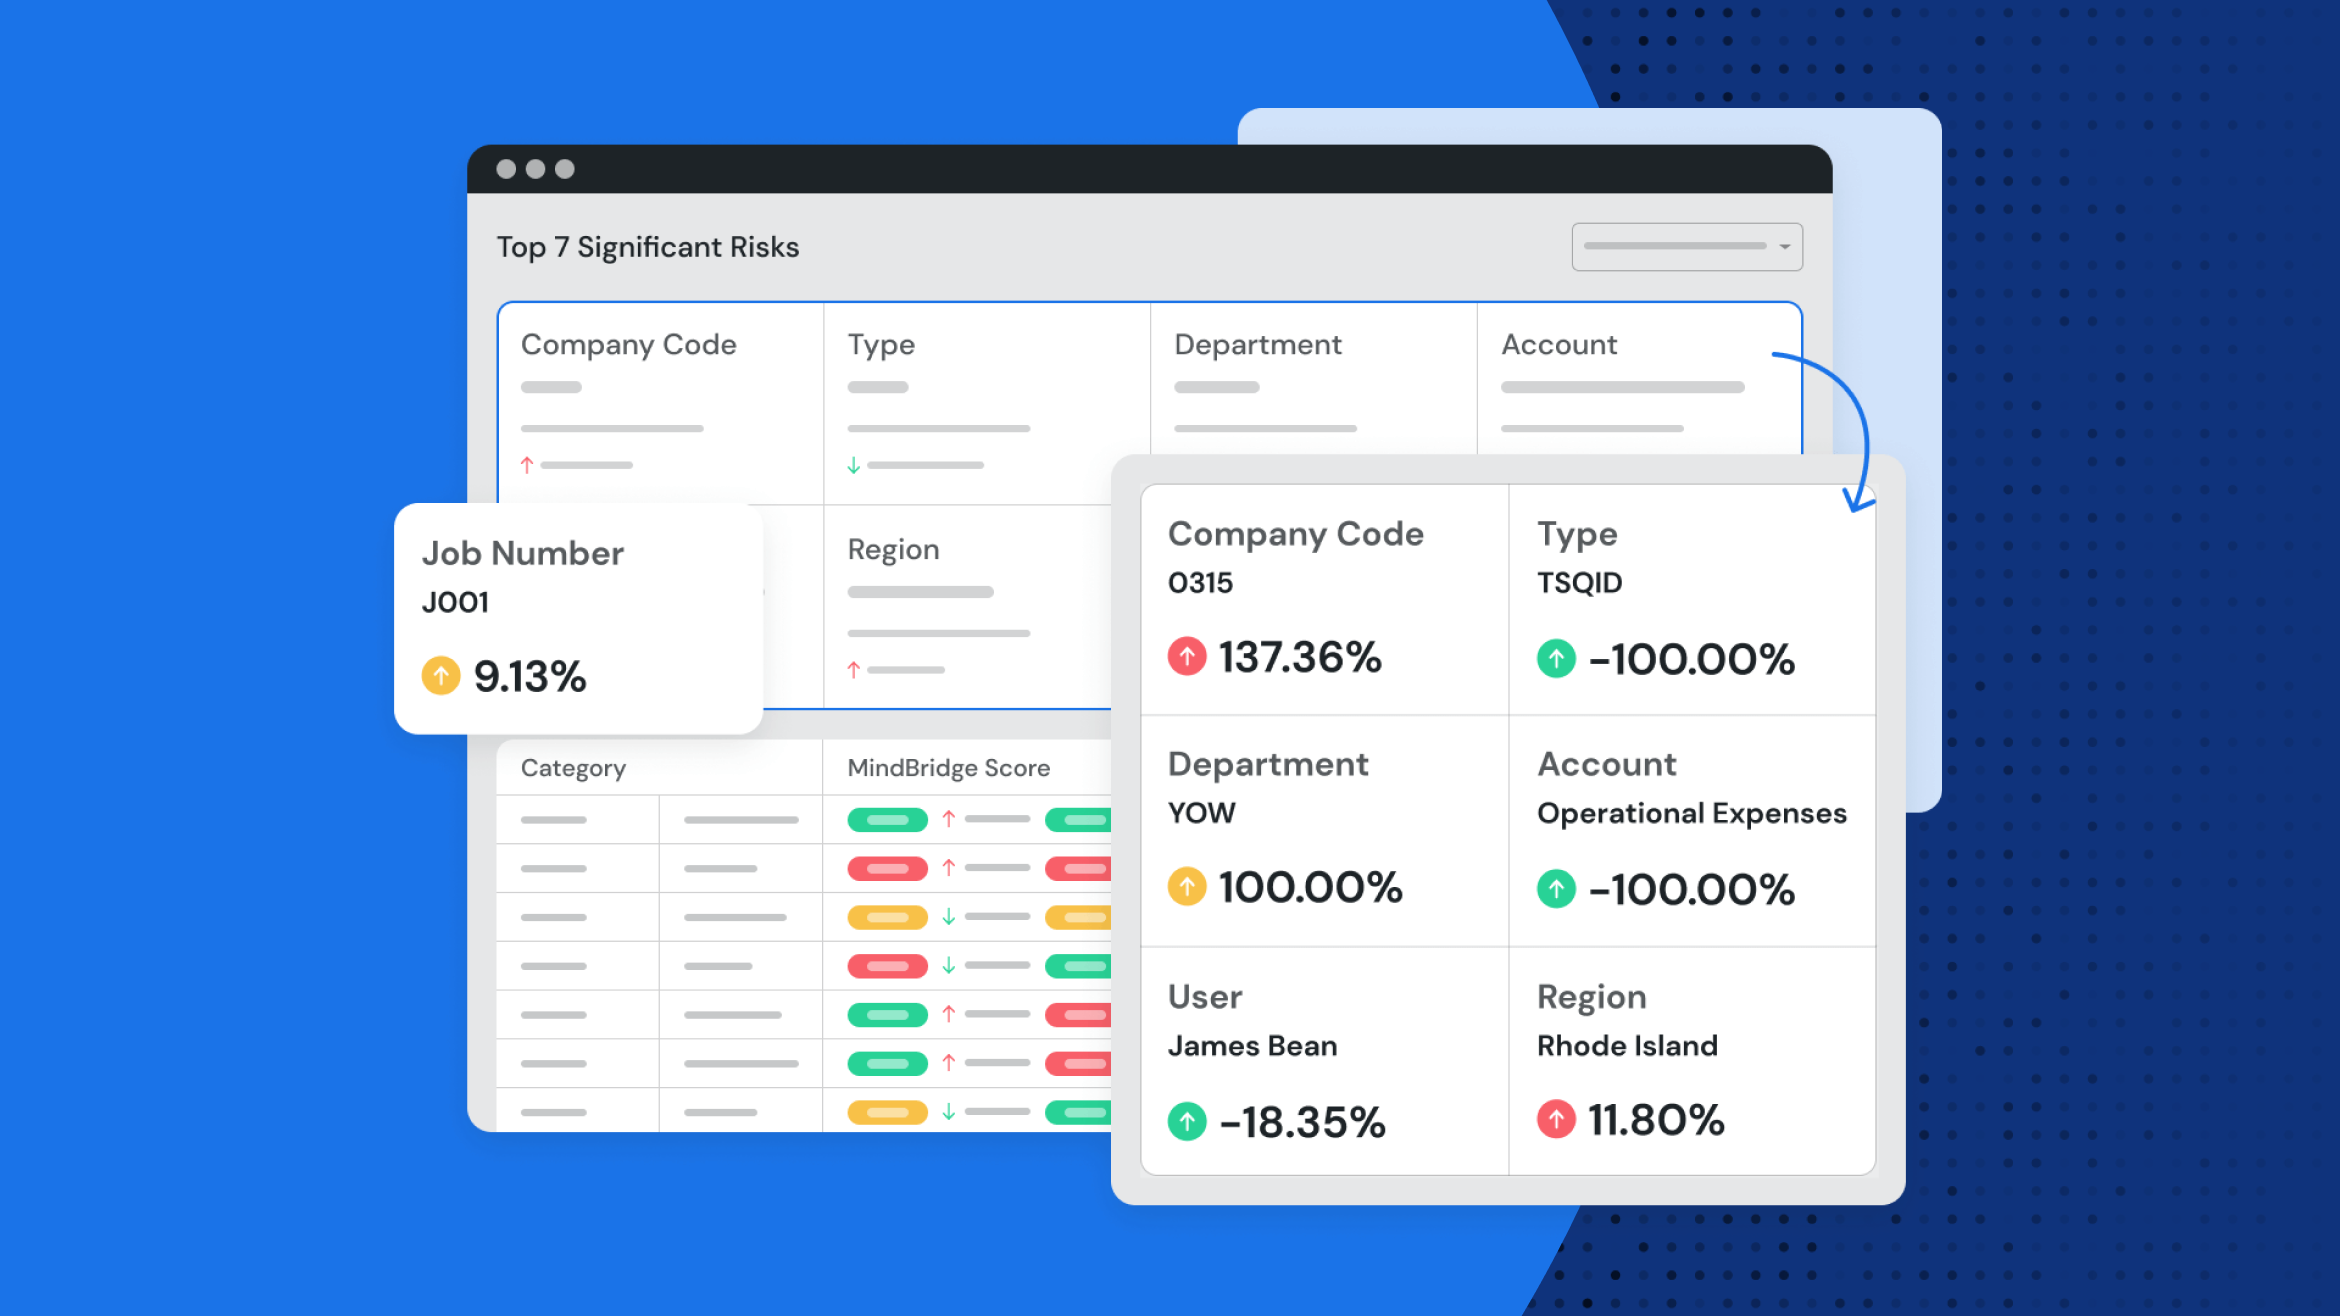
Trending dashboard

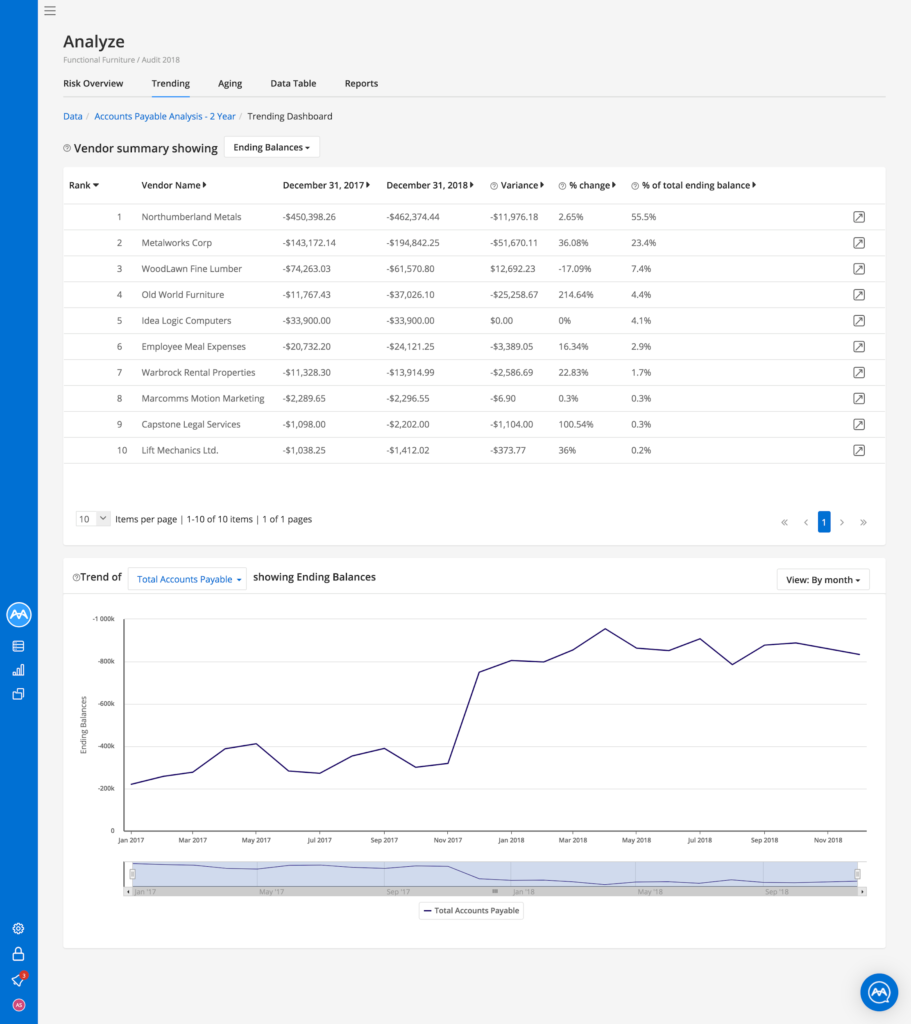
This dashboard contains a summary view of the top outstanding vendors (AP) and customers (AR), including a comparison of all balances to previous periods to determine any significant or unusual changes. You can filter the page by ending balance or total activity.

In the table below, you can see which customers or vendors require attention by looking at the balances.

Vendors or customers are ranked in order of the current year’s ending balance. Vendors or customers that didn’t exist in previous years will be marked as new.

You can see the change in dollar value between the prior and current year’s ending balance in the variance column and % change and % of total balance. To see what entries make up your current balance with each vendor or customer, you can drill down on the entry in the table to land on the Data table page which has the entries detail.

internal auditing techniques

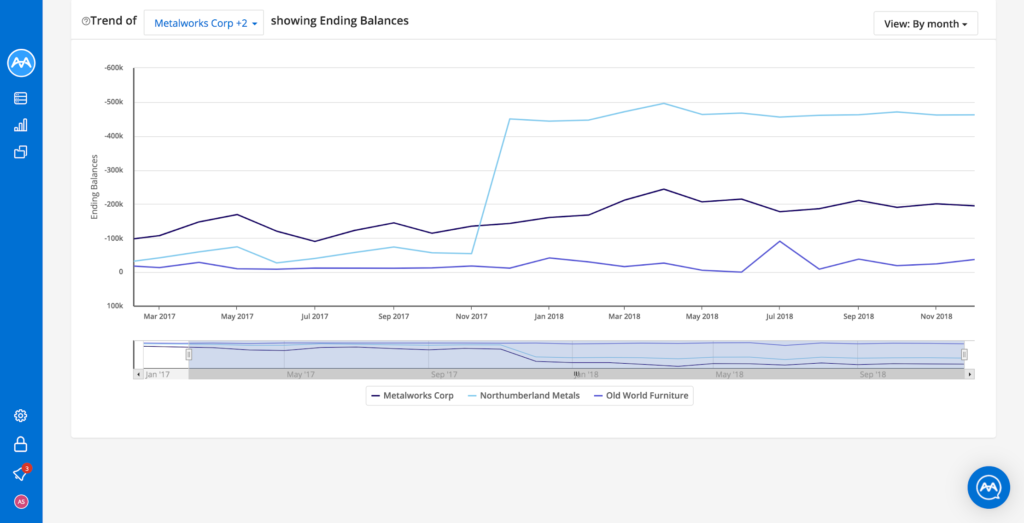
As illustrated below, you can gain a full understanding of the period-over-period changes by exploring vendors or customers on the accounts receivable side by month, quarter, and period. You can compare multiple vendor or customer balances by selecting multiple vendors/customers from the dropdown list.

You can also zoom into time periods of interest using the slider.

Aging dashboards

These dashboards contain metrics that help you to view each vendor/customer, the amount they are owed, and the amount of time they have been owed.

Based on these dashboards, you are able to:

  1. Recreate the aged AP or AR reports to compare to reports provided by the client.
  2. Understand the historical distribution of AP or AR balances to identify anomalies.
  3. In the AP analysis, identify old invoices outstanding to understand potential cash flow issues or misstatements in vendor balances.
  4. In the AR analysis, identify outstanding invoices to determine appropriateness of allowance for doubtful accounts.

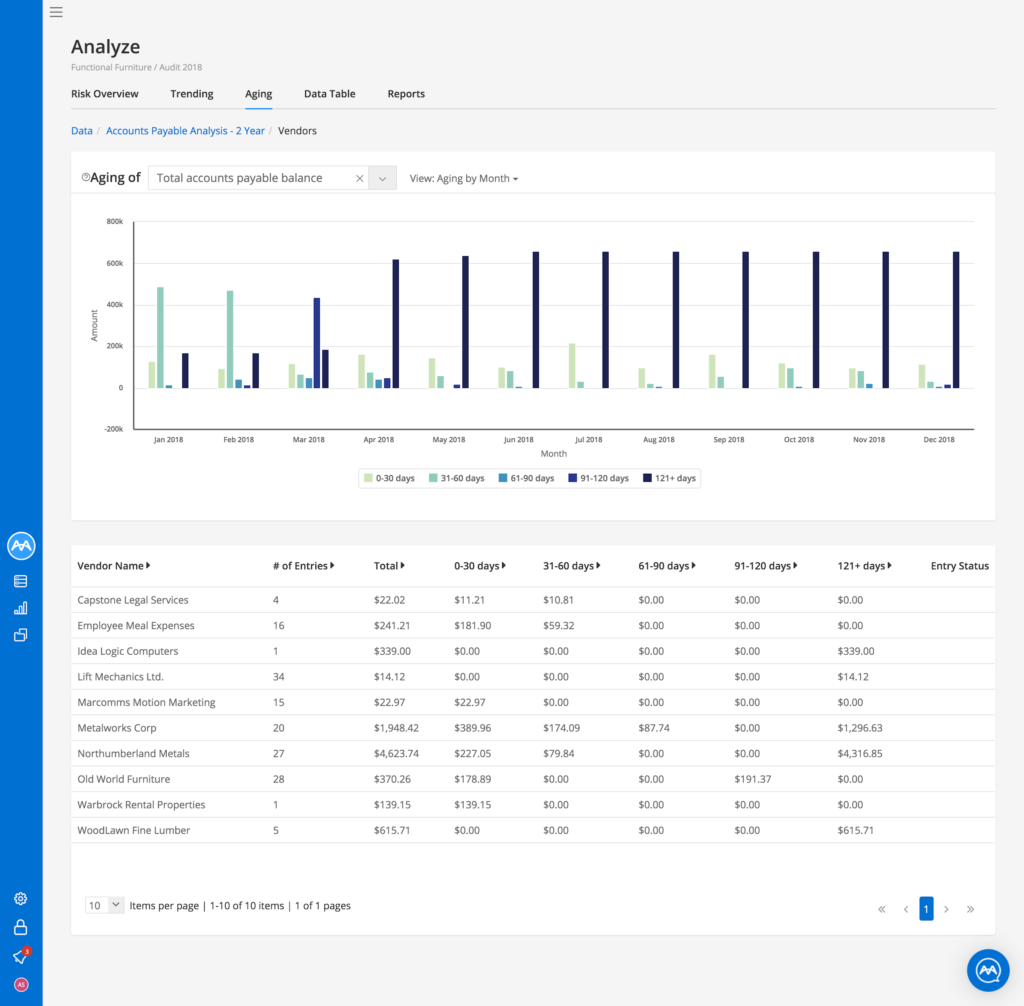
The Aging graph allows you to view the amount of money owed to each vendor/customer, and the amount of time that money has been owed. You can view either the total vendor/customer balances or the balances of specific ones. Time can be displayed by month, quarter, or period.

The Aging table allows you to find out the details on each vendor or customer and whether they were excluded from the aging visualization due to missing data.

Data table

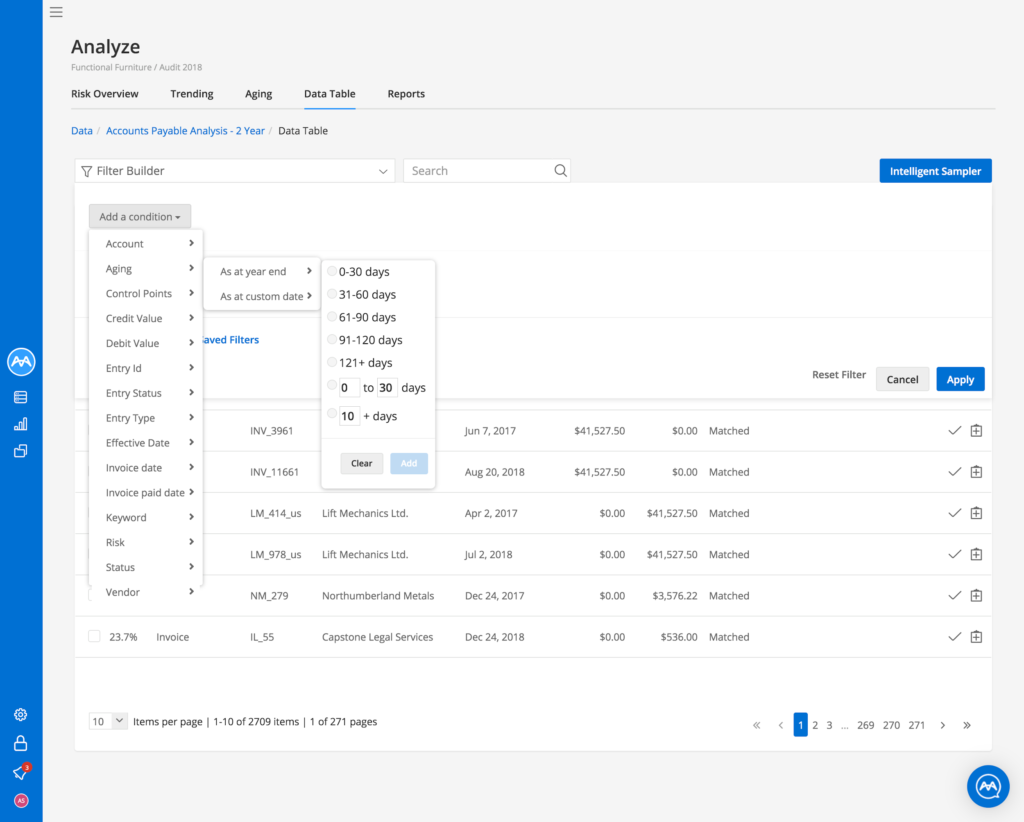
You can use the data table and Filter Builder to select the population of entries in the subledger to meet desired criteria and build tests.

Reports

Ai Auditor generates vendor and customer aging detail summaries that list individual invoices, credit notes, and over-payments owed for each vendor or customer, and how long these have gone.

Enhanced ingestion workflow

As our navigation updates continue to improve the experience, this release also brings enhancements to the data ingestion workflow.

The updated Data page (shown below) guides you through each step of the ingestion process. Since uploading different datasets unlocks different analytical capabilities, we list the features along the right side of the page. Clicking a feature will reveal the required dataset(s) for each.

With the new design, we also give you more freedom when importing files. You’re no longer required to upload the current year’s financial data before uploading any previous year(s) to the analysis.

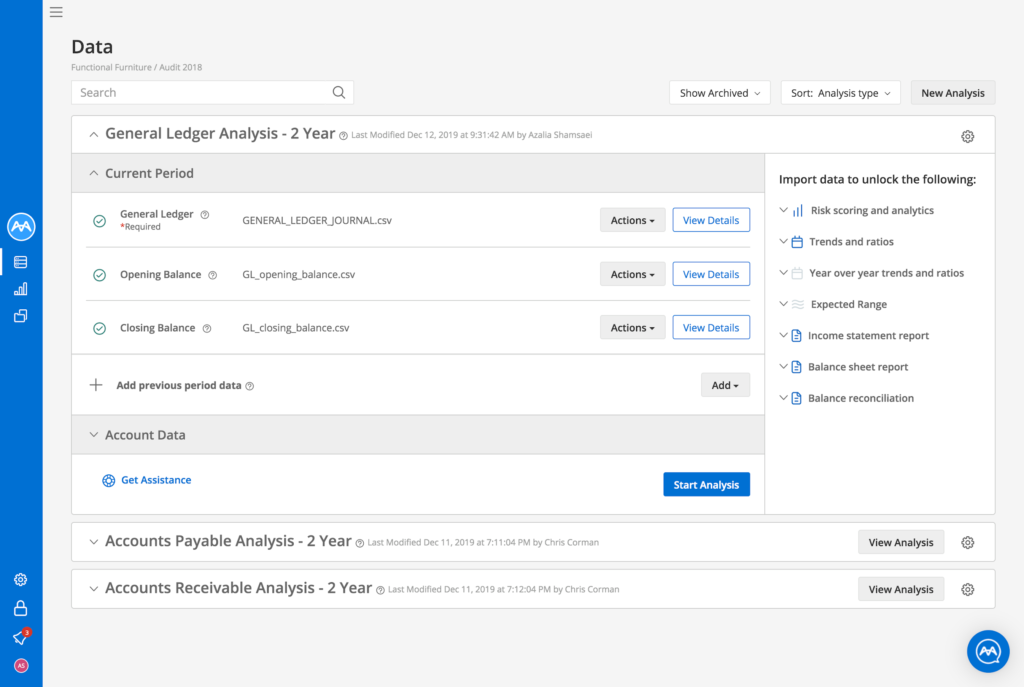
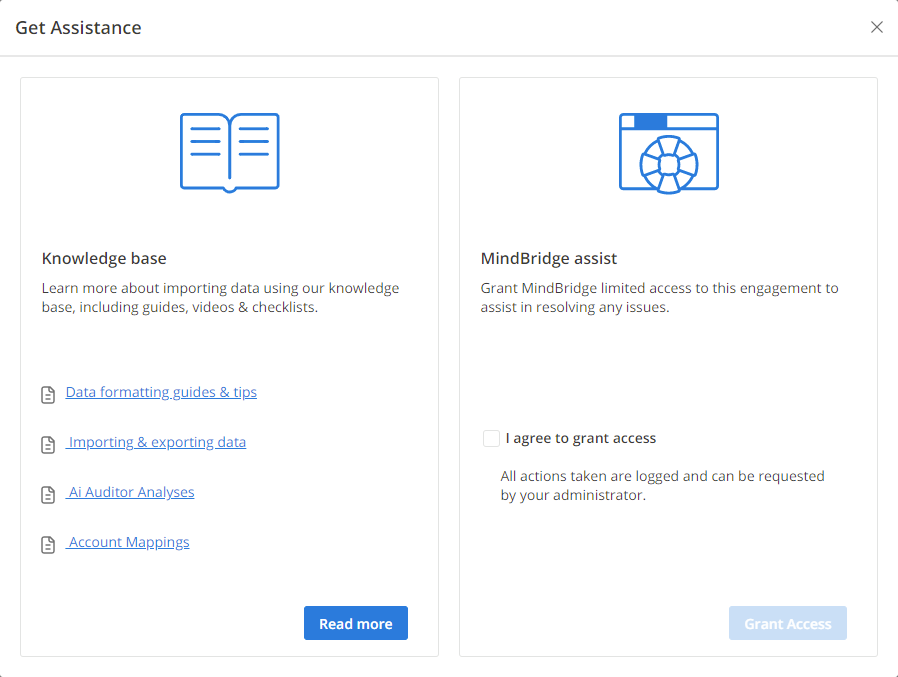
You can get assistance when uploading files by clicking on the Get Assistance button. This gives you access to articles in our knowledge base and to MindBridge assist to contact the MindBridge customer success team to help resolve any issues.

Customers can learn more about this release in our online documentation, or you can book a personalized demo here.

New Ai Auditor release: October 2019

Our latest release of MindBridge Ai Auditor is another leap forward, with plenty of great features to help auditors throughout the audit process. Keep reading to find lots to love about this release.

Task creation and sample selection

Auditors can select samples, either manually or by using our Intelligent Sampler, to stratify the population of financial data by risk rating. Creating tasks in Ai Auditor allows your team members to work collaboratively to investigate anomalies in your client’s data.

In this release, you can create tasks and leverage the Intelligent Sampler on individual line entries. Prior to this release, you could only use the feature on transactions.

You can create filters and select samples manually by creating tasks on individual line entries which will be added to your audit plan. You can also leverage the Intelligent Sampler to stratify sample selection on entry view as described in the next section.

When you go to the Data Table tab, you can click on a transaction and see the individual line entries associated with a transaction, as shown in Figure 1.You can switch to the entries view by clicking on the Transactions button on the top right corner of the page, as illustrated in Figure 2.As seen above, you can launch Intelligent Sampler from the Entries View and you can create tasks on a line item by clicking on the  button to add details to your task creation, including audit area for account balances or significant classes of transactions, as well as the related management assertion for the test being performed, as shown in Figure 3.You can also bulk select by checking the box on an individual line item and select the appropriate action item from the Actions drop-down as illustrated in Figure 4.Once you create a task on an entry, it will be added to your audit plan page.

Intelligent Sampler

Auditors can select samples, by using Intelligent Sampler, to stratify the population of financial data by risk rating. In this release, we have improved the Intelligent sampler, as shown in Figure 5.

We have added a random sampling option to the sampling method to create a truly random sample from the population generated in the applied filter. Each item in the population has an equal chance of being selected.

The default sampling method is risk-rated that uses the entry or transaction risk score to stratify the population generated in the applied filter. This method is unique to Ai Auditor, and favors selecting the majority of the sample from the high and medium risk transactions.

You now have the ability to add Audit Area, Management Assertions, and sample name to the sample selection. You can also add multiple samples to the same population. In addition, we provide a visualization that shows the $ value of the selected samples for each risk bucket (high, medium, and low risk) and the total $ value of all the populations for the sample. This can be used to reconcile the total population for created filters to worksheets used for sample size calculation.

You can click on “Add to audit plan” to add the sample to the Audit Plan.

Audit plan

The audit plan is one of our many exports that provide sufficient and appropriate audit evidence to support the audit opinion. In particular, the audit plan provides a summary of items selected using Ai Auditor while preparing to perform a test of details.

On the Audit Plan page, we now provide more filters, allowing you to filter by audit area to understand the areas you have looked into and what management assertions you have selected samples for. The visualization at the top of the page has been updated to highlight the $ value for the selected filter.

All items added to the audit plan can be searched or filtered in various ways to provide a convenient overview of your sample selection.From the Audit Plan page, you can view the revised Audit Plan Export as a Microsoft Excel or CSV document as a source of audit evidence to be saved in your working paper solution. We have also improved the performance of the CSV export for large files.

You can export the entire plan into Excel or CSV format by clicking on the Export Entire Plan button or add filters to create a simplified list of items for your client to prepare for your inspection by clicking on “Export Filtered Plan”.

We have also enhanced the audit export details for this release. We now show a summary of the engagement, date, and analysis name, as well as filters that have been applied to the audit plan, if any, in the Summary tab, as shown in Figure 7.In the Data Tab, there are three buckets that illustrate information about the transaction and/or entries, tasks, and Control Points. We have added the entries to the audit plan, as well as the audit area and assertion names. Another improvement to the audit plan is that we now show the risk scoring of each Control Point for each entry in the audit plan.

Large transaction support

Transactions that contain a large number of entries can be present in financial data for a number of different reasons, for example, a daily point of sale summary where a number of ‘micro-transactions’ are recorded into a larger ‘daily’ transaction.

These types of transactions can limit an auditor’s ability to assess the true transaction risk or identify problematic entries. In Ai Auditor, large transactions are also often given higher risk scores due to the fact that a large number of entries contribute in a disproportionate way to the overall transaction risk score versus other transactions with smaller numbers of entries.

To this end, we now recognize and suggest alternatives for the treatment of large transactions. During the loading of data in the Review Data stage, as illustrated in Figure 9, Ai Auditor displays statistics about the file, including details about the number of transactions and their corresponding number of entries. Through the new design of the Review Data page, you can quickly understand that there are 27108 transactions in your file and 509 of them are very large transactions as illustrated in the transaction length summary visualization.

Ai Auditor now allows the user to apply an operation to the file, the Smart Splitter, to decompose each large transaction down to its matching entries, where each entry pair is identified by matching offsetting debits and credits. After running Smart Splitter there are no transactions with 501-1000 entries.For example:Each matching pair is then labelled as a new smaller transaction in the file where it can be risk scored along with other transactions in the file.

When selecting the Smart Splitter option, you have the ability to select the fields within the file to use as the primary transaction ID. This selection is then used to process the file and match containing entries, after which a preview is displayed to the user prior to committing to the operation on the entire file.

At the completion of the Smart Splitter operation, all transactions will run through the Smart Splitter, and the user continues with the analysis, where they will see new transactions appearing in the analysis with updated identifiers representing each entry within the transaction.

Create engagement

We improved the engagement creation page and added planning Date and Final Analysis Date. The Planning Date field is used to approximate the period available for interim work. This date is the earliest date for which you intend on having data from your client to use in planning. This field is optional but must occur before the final analysis date. Adding a planning date helps our Customer Success team prioritize and time your engagement.

The Final Analysis Date is the date that you intend on receiving the data from your client. This field is now a required field as it helps our Customer Success team plan any intervention work (if required). The Engagement Lead is the primary contact responsible for leading the audit. They will receive any and all proactive communications from our Customer Success team about ERP documentation, support, etc.

Enhancements to Libraries

In the May release of Ai Auditor, we introduced the Library feature to provide further flexibility to administrators to tailor the work done based on the industry that your client operates in.

Libraries contain all the business logic needed to perform analysis within a particular industry or market and allow you to customize an analysis based on industry types with different ratios, filters, and Control Points.

Through Libraries, you find the right information at the right time, and this is a big step forward in helping you complete your work faster and with greater transparency. Libraries give you a way to build standardized audit approaches. In the previous releases of the Library feature, you could customize ratios, and filters only.

In this release, we continue to extend the functionality of Libraries by allowing you to edit Control Point weightings within a Library that can be leveraged and reused across an Engagement. As shown in Figure 13, you can change the weighting of each Control Point through the scroll bar and you can save or discard changes.

Activity Report

In this release, the administrator can now track and collect user actions and behavior to get a complete timeline of all user activities to establish the events that have occurred and who caused them. The Activity Report, as shown in Figure 14, answers the ‘who, what, when, where, and how’ of all the user activities in Ai Auditor. With the Activity Report, administrators get precise information on critical events such as user logins, time of file load, time of analysis, and more.

The administrator can also go to Activity Tab and download the Activity Report. They can filter on date range and user, as well as select the event categories such as who created the engagement, organization, ingestion, and more.

Figure 15 illustrates an example of the Activity Report that shows the times when the user:

  • Created the analysis
  • Deleted the analysis
  • Logged into Ai Auditor
  • Deleted and created some tasks
  • Created a Library called “Insurance”

New Ai Auditor release: August 2019

audit ai

Our latest release of MindBridge Ai Auditor is another leap forward, with plenty of great features to help auditors throughout the audit process. Keep reading to find lots to love about this release.

Enhancements to Libraries

In the May release of Ai Auditor, we introduced the Library feature to provide further flexibility to administrators to tailor the work done in Ai Auditor based on the industry that your client operates in.

Libraries contain all the business logic needed to perform analysis within a particular industry or market and allow you to customize an analysis based on industry types with different ratios, filters, and Control Points.

Through Libraries, you find the right information at the right time, and this is a big step forward in helping you complete your work faster and with greater transparency. Libraries give you a way to build standardized audit approaches. In the first release of the Library feature, custom ratios could be built, edited, and saved within a Library.

In this release, we continue to extend the functionality of Libraries by allowing you to define and store custom filters within a Library that can be leveraged and reused across an Engagement. Your firm can build up a suite of standard audit tests, focusing on particular transactions, and reuse them from client to client. To get you started, we’ve provided some predefined filters as illustrated in Figure 1. You can also construct and add your filters as illustrated in Figures 2 and 3.

Figure 1: Predefined filters in Ai Auditor
Figure 2: Adding and editing filters in Libraries
Figure 3: The Filter Builder

Enhancements to ratios

During the creation of an engagement, users can ensure the data is being correctly analyzed by selecting a Library that contains the proper financial ratios. The ratios correspond to the Library and are made available on the Trending tab in Ai Auditor. The administrator in a Library sets all default ratios.

We’ve recognized that the engagement team may need to define specific ratios for the engagements under review that are not defined in the selected Library. Therefore, in this release, we allow anyone who has access to the engagement to define a ratio through the Ratio Builder (Figure 4) and save it to the engagement. You can also customize the Trending tab by deleting or editing the custom ratios in the engagement as illustrated in Figure 5.

Once the engagement team has found a particularly useful ratio for a single client, an administrator can promote this ratio into the Library so that it is available immediately across all the clients sharing that Library.

Figure 4: Ratio Builder
Figure 5: Modifying custom ratio from an engagement

We have also made ratios easier to explain and understand by making a ratio’s calculation and values visible from the Trending tab’s ratio graph. As illustrated in the figure below, you can hover over a data point to see more information. Clicking on the data point now allows you to toggle between viewing a “value view” or “formula view” for each data point.

Figure 6: Viewing a data point’s information
 Figure 7: Toggling between formula and value views

Custom account groupings

Have you ever wanted to leverage and see your own client account numbers and account groupings in Ai Auditor rather than using the MindBridge Account Classification (MAC) codes?

In this release, we are thrilled to provide this capability in the product. Let’s elaborate more on the details and explain where you’ll see and make use of your own account codes instead of MAC codes.

MAC codes in Ai Auditor

Prior to this release, when mapping your accounts, Ai Auditor would automatically map your accounts to the MAC codes. This meant that everyone had to use these codes everywhere in the platform. For example, the Filter Builder illustrated in Figure 8 is based on MindBridge Account Classification codes.

Figure 8: The account hierarchy in Filter Builder – Old style MAC-based

Custom account codes in Ai Auditor

With this update, Ai Auditor now supports custom account groupings. Administrators can upload their custom grouping using the MindBridge Microsoft Excel template. If using CCH Working Papers, administrators can upload a group trial balance via the ACCOUNT GROUPINGS section under ADMIN, as illustrated in Figures 9 and 10.

Once the account grouping is loaded into Ai Auditor, it can be referenced by a Library and used to create filters and ratios that can be used in an engagement. All the users who have access to that engagement see the new account grouping everywhere throughout the product. Figure 11 illustrates an example of the custom grouping in the Filter Builder.

Figure 9: Import Custom Account Grouping
Figure 10: Managing custom Account Groupings
Figure 11: Using a custom account grouping in Filter Builder


Improvements to Control Points

As the year progresses, you will see a lot of new Control Point enhancements making their way into Ai Auditor. One popular piece of feedback received from customers is to provide more detailed explanations for Control Points. Our users want more insight as to why a certain transaction fired a certain Control Point, or how the Risk Score was determined.

In response to this, we’ve added more details pertaining to each Control Point, and why a transaction would trigger it. This helps you better understand our Control Points, how they function, and the associated risk.

We’ve added more detailed information for each Control Point with new tooltips. Clicking the tooltip icon in the upper right of each Control Point tile, as shown in figure 12, provides you with more information on each Control Point.

Figure 12: Control Point tiles

We have included a “Learn More” link within each tooltip that takes you to more documentation for each Control Point. We’ve also added a robust chart for the Benford Control Point (Figure 13) that is based on your actual data, providing more context and identifying numbers appearing at higher frequencies. This new visualization gives auditors an intuitive sense for why a Control Point has triggered and provides greater insight to auditors examining transactions that may contain an outlier.

Figure 13: Control Point detail


Not-For-Profit analysis improvements

Interim analysis support for Not-For-Profit (NFP)

In the May release of Ai Auditor, we introduced support for Not-For-Profit (NFP) General Ledger (GL) analyses. In this release, we’ve expanded this functionality to support a General Ledger (Interim) analysis, allowing you to upload a partial GL file and analyze the available data.

An example of an interim analysis would be 9 months of GL activity. You can return to this analysis at a later point once you have the remaining GL data, facilitating a continuous and seamless workflow.

You can also add data from previous years to the analysis, allowing you to view and identify trends. Currently, you can compare your current GL against up to five years of historical data in the year-over-year trended view for your NFP analysis.

Figure 14: General Ledger (Interim) support for NFP analysis
Figure 15: Support for previous years in a NFP analysis

Improvements to data ingestion

In this release, column mapping settings are available to view after completing a data ingestion. These changes make finding missteps in the mapping process much easier, resulting in higher quality support for issues or errors regarding column mapping.

We’ve also made improvements to the transaction ID generator in the review data stage. When performing a GL analysis, if you’re carrying forward the interim analysis, you no longer need to create a transaction ID. Ai Auditor recommends the appropriate transaction ID based on the interim analysis previously performed.

Figure 16: Column mapping
Figure 17: Carrying forward the interim analysis transaction ID